Category: AWS Lambda

Azure Functions Performance – Update on EP1 Results

In yesterdays post comparing Azure Functions to AWS Lambda the EP1 plan was a notable poor performer – to the extent I wandered if it was an anomalous result. For context here is yesterday’s results for a low load test:

I created a new plan this morning with a view to exploring the results further and I think I can provide some additional insight into this.

You shouldn’t have to “warm” a Premium Plan but to be sure and consistent I ran these tests after allowing for an idle / scale down period and then making a single request for a Mandelbrot.

The data here is based around a test making 32 concurrent requests to the Function App for a single Mandelbrot. Here is the graph for the initial run.

First if we consider the overall statistics for the full run – they are still not great. If I pop those into the comparison chart I used yesterday EP1 is still trailing – the blue column is yesterdays EP1 result and the green line todays.

Its improved – but its still poor. However if we look at the graph of the run over time we can see its something of a graph of two halves and I’ve highlighted two sections of it (with the highlight numbers in the top half):

There is a marked increase in response time and request per second rate between the two halves. Although I’m not tracking the instance IDs I would conclude that Azure Functions scaled up to involve a second App Service Instance and that resulted in the improved throughput.

To verify this I immediately ran the test again to take advantage of the increased resource availability in the Function Plan and that result is shown below along with another comparative graph of the run in context.

We can see here that the EP1 plan is now in the same kind of ballpark as Lambda and the EP2 plan. As two EP1 instances in play we are now running with a similar amount of total compute as the EP1 plan – just on two 210 ACU instances rather than one 420 ACU instance.

To obtain this level of performance we are sacrificing consumption based billing and moving to a baseline cost of £0.17 per hour (£125 per month) bursting to £0.34 per hour (£250 per month) to cover this low level of load.

Conclusions

I would argue this verifies yesterdays results – with a freshly deployed Function App we have obtained similar results and by looking at its behavior over time we can see how Azure Functions is adding resource to an EP1 plan then giving us similar total resource to the EP2 plan and similar results.

Every workload is different and I would always encourage this but based on this I would strongly suggest that if you’re using Premium Plan’s you dive into your workload and seek to understand if it is a cost effective use of your spend.

Comparative performance of Azure Functions and AWS Lambda

Update: the results below showed the EP1 plan to be a clear outlier in some of its performance results. I’ve since retested on a fresh EP1 plan and confirmed these results as accurate and been able to provide further insight into the performance: Azure Functions Performance – Update on EP1 Results – Azure From The Trenches.

I was recently asked if I would spend some time comparing AWS Lambda with Azure Functions at a meetup – of course, happily! As part of that preparing for that I did a bit of a dive into the performance aspects of the two systems and I think the results are interesting and useful and so I’m also going to share them here.

Test Methodology

Methodology may be a bit grand but here’s how I ran the tests.

The majority of the tests were conducted with SuperBenchmarker against systems deployed entirely in the UK (eu-west-2 on AWS and UK South on Azure). I interleaved the results – testing on AWS, testing on Azure, and ran the tests multiple times to ensure I was getting consistent results.

I’ve not focused on cold start as Mikhail Shilkov has covered that ground excellently and I really have nothing to add to his analysis:

Cold Starts in Azure Functions | Mikhail Shilkov
Cold Starts in AWS Lambda | Mikhail Shilkov

I essentially focused on two sets of tests – an IO workload (flushing a queue and writing some blobs) and a compute workload (calculating a mandelbrot and returning it as an image).

All tests are making use of .NET Core 3.1 and I’ve tested on the following configurations:

  1. Azure Functions – Consumption Plan
  2. Azure Functions – EP1 Premium Plan
  3. Azure Functions – EP2 Premium Plan
  4. AWS Lambda – 256 Mb
  5. AWS Lambda – 1024 Mb
  6. AWS Lambda – 2048 Mb

Its worth noting that Lambda assigns a proportion of CPU(s) based on the allocated memory – more memory means more horsepower and potentially multiple cores (beyond the 1.8Gb mark if memory serves).

Queue Processing

For this test I preloaded a queue with 10,000 and 100,000 queue items and wrote the time the queue item was processed to a blob file (a file per queue item). The measured times are between the time the first blob was created and the time the last blob was created.

On Azure I made use of Azure Queue Storage and Azure Blob Storage and on AWS I used SQS and S3.

AWS was the clear winner of this test and from the shape of the data it appeared that AWS was accelerating faster than Azure – more eager to process more items but I would need to do further testing to compare. However it is possible the other services were a influencing factor. However its a reasonable IO test on common services by a function.

HTTP Trigger under steady load

This test was focused on a compute workload – essentially calculating a Mandelbrot. The Function / Lambda will generate n lambda’s based on a query parameter. The Mandelbrots are generated in parallel using the Task system.

32 concurrent requests, 1 Mandelbrot per request

Percentile and average response times can be seen in the graph below (lower is better):

With this low level of low all the services performed acceptable. The Azure Premium Plans strangely perform the worst with the EP1 service being particularly bad. I reran this several times and received similar results.

The range of response times (min, max) can be seen below alongside the average where we can see again followed by the total number of requests served over the 2 minute period:

32 concurrent requests, 8 Mandelbrots per request

In this test each request results in the Lambda / Function calculating the Mandelbrot 8 times in parallel and then returning one of the Mandelbrots as an image.

Percentile and average response times can be seen in the graph below (lower is better):

Things get a bit more interesting here. The level of compute is beyond the proportion of CPU assigned to the 256Mb Lambda and it struggles constantly. The Consumption Plan and EP1 Premium Plan fair a little better but are still impacted. However the 1024Mb and 2048Mb Lambda’s are comfortable – with the latter essentially being unchanged.

The range of response times (min, max) can be seen below alongside the average where we can see again followed by the total number of requests served over the 2 minute period:

I don’t think there’s much to add here – it largely plays out as you’d expect.

HTTP undergoing a load spike

In this test I ran at a low and steady rate of 2 concurrent requests for 1 Mandelbrot over 4 minutes. After around 1 to 2 minutes time I then loaded the system, independently, with a spike of 64 concurrent requests for 8 Mandelbrots.

Azure

First up Azure with the Consumption Plan:

Its clear to see in this graph where the additional load begins and, unfortunately, Azure really struggles with this. Served requests largely flatline throughout the spike. To provide more insight here’s a graph of the spike (note: I actually captured this from a later run but the results were the same as this first run).

Azure struggled to serve any of this. It didn’t fail any requests but performance really has nosedived.

I captured the same data for the EP1 and EP2 Premium Plans and these can be seen below:

Unfortunately Azure continues to struggle – even on an EP2 plan (costing £250 per month at a minimum). The spike data was broadly the same as in the Consumption plan run.

I would suggest this is due to Azure’s fairly monolithic architecture – all of our functions are running in shared resource and the more expensive requests can sink the entire shared space and Azure isn’t able to address this.

Lambda

First up the 256Mb Lambda:

We can see here that the modest 1 Mandelbrot requests made to the Lambda are untroubled by the Spike. You can see a slight rise in response time and drop in RPS when the additional load hits but overall the Lambda maintains consistent performance. You can see what is happening in the spike below:

Like in our earlier tests the 256 Mb Lambda struggles with the request for 8 Mandelbrot’s – but its performance is isolated away from the smaller requests due to Lambda’s more isolated architecture. The additional spikes showed characteristics similar to the runs measured earlier. The 1024 Mb and 2048 Mb run are shown below:

Again they run at a predicable and consistent rate. The graphs for the spikes behaved in line with performance of their respective consistent loads.

Spike Test Results Summary

Based on the above its unsurprising that the overall metrics are heavily in favour of AWS Lambda.

Concluding Thoughts

Its fascinating to see how the different architectures impact the scaling and performance characteristics of the service. With Lambda being based around containerized Functions then as long as the workload of a specific request fits within a containers capabilities performance remains fairly constant and consistent and any containers that are stretched have isolated impact.

As long as you measure, understand and plan for the resource requirements of your workloads Lambda can present a fairly consistent consumption based pricing scaling model.

Whereas Azure Functions uses the coarse App Service Instance scaling model – many functions are running within a single resource and this means that additional workload can stretch a resource beyond its capabilities and have an adverse effect on the whole system. Even spending more money has a limited impact for spikes – we would need resources that can manage the “peak peak” request workloads.

I’ve obviously only pushed these systems so far in these tests – enough to show the weaknesses in the Azure Functions compute architecture but not enough to really expose Lambda. That’s something to return to in a future installment.

In my view the Azure Functions infrastructure needs a major overall in order to be performance competitive. It has a FaaS programming model shackled to and held back by a traditional web server architecture. Though I am surprised by the EP1 results and will reach out to the Functions team.

Azure Functions – Significant Improvements in HTTP Trigger Scaling

A while back I wrote about the improvements Microsoft were working on in regard to the HTTP trigger function scaling issues. The Functions team got in touch with me this week to let me know that they had an initial set of improvements rolling out to Azure.

To get an idea of how significant these improvements are I’m first going to contrast this new update to Azure Functions with my previous measurements and then re-examine Azure Functions in the wider context of the other cloud vendors. I’m specifically separating out the Azure vs Azure comparison from the Azure vs Other Cloud Vendors comparison as while the former is interesting given where Azure found itself in the last set of tests and to highlight how things have improved but isn’t really relevant in terms of a “here and now” vendor comparison.

A quick refresh on the tests – the majority of them are run with a representative typical real world mix of a small amount of compute and a small level of IO though tests are included that remove these and involve no IO and practically no computer (return a string).

Although the improvements aren’t yet enabled by default towards the end of this post I’ll highlight how you can enable these improvements for your own Function Apps.

Azure Function Improvements

First I want to take a look at Azure Functions in isolation and see just how the new execution and scaling model differs from the one I tested in January. For consistency the tests are conducted against the exact same app I tested back in January using the same VSTS environment.

Gradual Ramp Up

This test case starts with 1 user and adds 2 users per second up to a maximum of 500 concurrent users to demonstrate a slow and steady increase in load.

This is the least demanding of my tests but we can immediately see how much better the new Functions model performs. When I ran these tests in January the response time was very spiky and averaged out around the 0.5 second mark – the new model holds a fairly steady 0.2 seconds for the majority of the run with a slight increase at the tail and manages to process over 50% more requests.

Rapid Ramp Up

This test case starts with 10 users and adds 10 users every 2 seconds up to a maximum of 1000 concurrent users to demonstrate a more rapid increase in load and a higher peak concurrency.

In the previous round of tests Azure Functions really struggled to keep up with this rate of growth. After a significant period of stability in user volume it eventually reached a state of being semi-acceptable but the data vividly showed a system really straining to respond and gave me serious concerns about its ability to handle traffic spikes. In contrast the new model grows very evenly with the increasing demand and, other than a slight spike early on, maintaining a steady response time throughout.

Immediate High Demand

This test case starts immediately with 400 concurrent users and stays at that level of load for 5 minutes demonstrating the response to a sudden spike in demand.

Again this test highlights what a significant improvement has been made in how Azure Functions responds to demand – the new model is able to deal with the sudden influx of users immediately, whereas in January it took nearly the full execution of the test for the system to catch up with the demand.

Stock Functions

This test uses the stock “return a string” function provided by each platform (I’ve captured the code in GitHub for reference) with the immediate high demand scenario: 400 concurrent users for 5 minutes.

The minimalist nature of this test (return a string) very much highlights the changes made to the Azure Functions hosting model and we can see that not only is there barely any lag in growing to meet the 400 user demand but that response time has been utterly transformed. It’s, to say the least, a significant improvement over what I saw in January when even with essentially no code to execute and no IO to perform Functions suffered from horrendous performance in this test.

Percentile Performance

I was unable to obtain this data from VSTS and so resorted to running Apache Benchmarker. For this test I used settings of 100 concurrent requests for a total of 10000 requests, collected the raw data, and processed it in Excel. It should be noted that the network conditions were less predictable for these tests and I wasn’t always as geographically close to the cloud function as I was in other tests though repeated runs yielded similar patterns:

Yet again we can see the massive improvements made by the Azure Functions team – performance remains steady up until 99.9th percentile. Full credit to the team – the improvement here is so significant that I actually had to add in the fractional percentiles to uncover the fall off.

Revised Comparison With Other Vendors

We can safely say by now that this new hosting model for Azure Functions is a dramatic improvement for HTTP triggered functions – but how does it compare with the other vendors? Last time round Functions was barely at the party – this time… lets see!

Gradual Ramp Up

On our gradual ramp up test Azure still lags behind both AWS and Google in terms of response time but actually manages a higher throughput than Google. As demand grows Azure is also experiencing a slight deterioration in response time where the other vendors remain more constant.

Rapid Ramp Up

Response time and throughput results for our rapid ramp up test are not massively dissimilar to the gradual ramp up test. Azure experiences a significant fall in performance around the 3 minute mark as the number of users approaches 1000 – but as I said earlier the Functions team are working on further area at this level of scale and beyond and I would assume at this point that some form of resource reallocation is causing this that needs smoothing out.

It’s also notable that although some way behind AWS Lambda Azure manages a reasonably higher throughput that Google Cloud – in fact it’s almost half way between the two competing vendors so although response times are longer there seems to be more overall capacity which could be an important factor in any choice between those two platforms.

Immediate High Demand

Again we see very much the same pattern – AWS Lambda is the clear leader in both response time and throughput while 2nd place for response time goes to Google and 2nd place for throughput goes to Azure.

Stock Functions

Interestingly in this comparison of stock functions (returning a string and so very isolated) we can see that Azure Functions has drawn extremely close to AWS Lambda and ahead of Google Cloud which really is an impressive improvement.

This suggests that other factors are now playing a proportionally bigger factor in the scaling tests than Functions capability to scale – previously this was clearly driving the results. Additional tests would need to be run to isolate if this is the case and whether or not this is related to the IO capabilities of the Functions host or the capabilities of external dependencies.

Percentile Performance

The percentile comparison shows some very interesting differences between the three platforms. At lower percentiles AWS and Google outperform Azure however as we head into the later percentiles they both deteriorate while Azure deteriorates more gradually with the exception of the worst case response time.

Across the graph Azure gives a more generally even performance suggesting that if consistent performance across a broader percentile range is more important than outright response time speed it may be a better choice for you.

Enabling The Improvements

The improvements I’ve measured and highlighted here are not yet enabled by default, but will be with the next release. In the meantime you can give them a go by adding an App Setting with the name WEBSITE_HTTPSCALEV2_ENABLED to 1.

Conclusions

In my view the Azure Functions team have done some impressive work in a fairly short space of time to transform the performance of Azure Functions triggered by HTTP requests. Previously the poor performance made them difficult to recommend except in a very limited range of scenarios but the work the team have done has really opened this up and made this a viable platform for many more scenarios. Performance is much more predictable and the system scales quickly to deal with demand – this is much more in line with what I’d hoped for from the platform.

I was sceptical about how much progress was possible without significant re-architecture but, as an Azure customer and someone who wants great experiences for developers (myself included), I’m very happy to have been wrong.

In the real world representative tests there is still a significant response time gap for HTTP triggered compute between Azure Functions and AWS Lambda however it is not clear from these tests alone if this is related to Functions or other Azure components. Time allowing I will investigate this further.

Finally my thanks to the @azurefunctions team, @jeffhollan and @davidebbo both for their work on improving Azure Functions but also for the ongoing dialogue we’ve had around serverless on Azure – it’s great to see a team so focused on developer experience and transparent about the platform.

If you want to discuss my findings or tech in general then I can be found on Twitter: @azuretrenches.

Azure Functions – Scaling with a Dedicated App Service Plan

Since I published this piece Microsoft have made significant improvements to HTTP scaling on Azure Functions. I’ve not yet had the opportunity to test performance on dedicated app service plans but please see this post for a revised comparison on the Consumption Plan.

After my last few posts on the scaling of Azure Functions I was intrigued to see if they would perform any better running on a dedicated App Service Plan. Hosting them in this way allows for the functions to take full advantage of App Service features but, to my mind, is no long a serverless approach as rather than being billed based on usage you are essentially renting servers and are fully responsible for scaling.

I conducted a single test scenario: an immediate load of 400 concurrent users running for 5 minutes against the “stock” JavaScript function (no external dependencies, just returns a string) on 4 configurations:

  1. Consumption Plan – billed based on usage – approximately $130 per month
    (based on running constantly at the tested throughput that is around 648 million functions per month)
  2. Dedicated App Service Plan with 1 x S1 server -$73.20 per month
  3. Dedicated App Service Plan with 2 x S1 server – $146.40 per month
  4. Dedicated App Service Plan with 4 x S1 server – $292.80 per month

I also included AWS Lambda as a reference point.

The results were certainly interesting:

With immediately available resource all 3 App Service Plan configurations begin with response times slightly ahead of the Consumption Plan but at around the 1 minute mark the Consumption Plan overtakes our single instance configuration and at 2 minutes creeps ahead of the double instance configuration and, while the advantage is slight, at 3 minutes begins to consistently outperform our 4 instance configuration. However AWS Lambda remains some way out in front.

From a throughput perspective the story is largely the same with the Consumption Plan taking time to scale up and address the demand but ultimately proving more capable than even the 4x S1 instance configuration and knocking on the door of AWS Lambda. What I did find particularly notable is the low impact of moving from 2 to 4 instances on throughput – the improvement in throughput is massively disappointing – for incurring twice the cost we are barely getting 50% more throughput. I have insufficient data to understand why this is happening but do have some tests in mind that, time allowing, I will run and see if I can provide further information.

At this kind of load (650 million requests per month) from a bang per buck point of view Azure Functions on the Consumption Plan come out strongly compared to App Service instances even if we don’t allowing for quiet periods when Functions would incur less cost. If your scale profile falls within the capabilities of the service it’s worth considering though it’s worth remembering their isn’t really an SLA around Functions at the moment when running on the Consumption Plan (and to be fair the same applies to AWS Lambda).

If you don’t want to take advantage of any of the additional features that come with a dedicated App Service plan and although they can be provisioned to avoid the slow ramp up of the Consumption Plan are expensive in comparison.

Azure Functions vs AWS Lambda vs Google Cloud Functions – JavaScript Scaling Face Off

Since I published this piece Microsoft have made significant improvements to HTTP scaling on Azure Functions and the below is out of date. Please see this post for a revised comparison.

I had a lot of interesting conversations and feedback following my recent post on scaling a serverless .NET application with Azure Functions and AWS Lambda. A common request was to also include Google Cloud Functions and a common comment was that the runtimes were not the same: .NET Core on AWS Lambda and .NET 4.6 on Azure Functions. In regard to the latter point I certainly agree this is not ideal but continue to contend that as these are your options for .NET and are fully supported and stated as scalable serverless runtimes by each vendor its worth understanding and comparing these platforms as that is your choice as a .NET developer. I’m also fairly sure that although the different runtimes might make a difference to outright raw response time, and therefore throughput and the ultimate amount of resource required, the scaling issues with Azure had less to do with the runtime and more to do with the surrounding serverless implementation.

Do I think a .NET Core function in a well architected serverless host will outperform a .NET Framework based function in a well architected serverless host? Yes. Do I think .NET Framework is the root cause of the scaling issues on Azure? No. In my view AWS Lambda currently has a superior way of managing HTTP triggered functions when compared to Azure and Azure is hampered by a model based around App Service plans.

Taking all that on board and wanting to better evidence or refute my belief that the scaling issues are more host than framework related I’ve rewritten the test subject as a tiny Node / JavaScript application and retested the platforms on this runtime – Node is supported by all three platforms and all three platforms are currently running Node JS 6.x.

My primary test continues to be a mixed light workload of CPU and IO (load three blobs from the vendors storage offering and then compile and run a handlebars template), the kind of workload its fairly typical to find in a HTTP function / public facing API. However I’ve also run some tests against “stock” functions – the vendor samples that simply return strings. Finally I’ve also included some percentile based data which I obtained using Apache Benchmark and I’ve covered off cold start scenarios.

I’ve also managed to normalise the axes this time round for a clearer comparison and the code and data can all be found on GitHub:

https://github.com/JamesRandall/serverlessJsScalingComparison

(In the last week AWS have also added full support for .NET Core 2.0 on Lambda – expect some data on that soon)

Gradual Ramp Up

This test case starts with 1 user and adds 2 users per second up to a maximum of 500 concurrent users to demonstrate a slow and steady increase in load.

The AWS and Azure results for JavaScript are very similar to those seen for .NET with Azure again struggling with response times and never really competing with AWS when under load. Both AWS and Azure exhibit faster response times when using JavaScript than .NET.

Google Cloud Functions run fairly close to AWS Lambda but can’t quite match it for response time and fall behinds on overall throughput where it sits closer to Azure’s results. Given the difference in response time this would suggest Azure is processing more concurrent incoming requests than Google allowing it to have a similar throughput after the dip Azure encounters at around the 2:30 mark – presumably Azure allocates more resource at that point. That dip deserves further attention and is something I will come back to in a future post.

Rapid Ramp Up

This test case starts with 10 users and adds 10 users every 2 seconds up to a maximum of 1000 concurrent users to demonstrate a more rapid increase in load and a higher peak concurrency.

Again AWS handles the increase in load very smoothly maintaining a low response time throughout and is the clear leader.

Azure struggles to keep up with this rate of request increase. Response times hover around the 1.5 second mark throughout the growth stage and gradually decrease towards something acceptable over the next 3 minutes. Throughput continues to climb over the full duration of the test run matching and perhaps slightly exceeding Google by the end but still some way behind Amazon.

Google has two quite distinctively sharp drops in response time early on in the growth stageas the load increases before quickly stabilising with a response time around 140ms and levels off with throughput in line with the demand at the end of the growth phase.

I didn’t run this test with .NET, instead hitting the systems with an immediate 1000 users, but nevertheless the results are inline with that test particularly once the growth phase is over.

Immediate High Demand

This test case starts immediately with 400 concurrent users and stays at that level of load for 5 minutes demonstrating the response to a sudden spike in demand.

Both AWS and Google scale quickly to deal with the sudden demand both hitting a steady and low response time around the 1 minute mark but AWS is a clear leader in throughput – it is able to get through many more requests per second than Google due to its lower response time.

Azure again brings up the rear – it takes nearly 2 minutes to reach a steady response time that is markedly higher than both Google and AWS. Throughput continues to increase to the end of the test where it eventually peaks slightly ahead of Google but still some way behind AWS. It then experiences a fall off which is difficult to explain from the data available.

Stock Functions

This test uses the stock “return a string” function provided by each platform (I’ve captured the code in GitHub for reference) with the immediate high demand scenario: 400 concurrent users for 5 minutes.

With the functions essentially doing no work and no IO the response times are, as you would expect, smaller across the board but the scaling patterns are essentially unchanged from the workload function under the same load. AWS and Google respond quickly while Azure ramps up more slowly over time.

Percentile Performance

I was unable to obtain this data from VSTS and so resorted to running Apache Benchmarker. For this test I used settings of 100 concurrent requests for a total of 10000 requests, collected the raw data, and processed it in Excel. It should be noted that the network conditions were less predictable for these tests and I wasn’t always as geographically close to the cloud function as I was in other tests though repeated runs yielded similar patterns:

AWS maintains a pretty steady response time up to and including the 98th percentile but then shows marked dips in performance in the 99th and 100th percentiles with a worst case of around 8.5 seconds.

Google dips in performance after the 97th percentile with it’s 99th percentile roughly equivalent to AWSs 100th percentile and it’s own 100th percentile being twice as slow.

Azure exhibits a significant dip in performance at the 96th percentile with a sudden drop in response time from a not great 2.5 seconds to 14.5 seconds – in AWSs 100th percentile territory. Beyond the 96th percentile their is a fairly steady decrease in performance of around 2.5 seconds per percentile.

Cold Starts

All the vendors solutions go “cold” after a time leading to a delay when they start. To get a sense for this I left each vendor idle overnight and then had 1 user make repeat requests for 1 minute to illustrate the cold start time but also get a visual sense of request rate and variance in response time:

Again we have some quite striking results. AWS has the lowest cold start time of around 1.5 seconds, Google is next at 2.5 seconds and Azure again the worst performer at 9 seconds. All three systems then settle into a fairly consistent response time but it’s striking in these graphs how AWS Lambda’s significantly better performance translates into nearly 3x as many requests as Google and 10x more requests than Azure over the minute.

It’s worth noting that the cold start time for the stock functions is almost exactly the same as for my main test case – the startup is function related and not connected to storage IO.

Conclusions

AWS Lambda is the clear leader for HTTP triggered functions – on all the runtimes I’ve tried it has the lowest response times and, at least within the volumes tested, the best ability to deal with scale and the most consistent performance. Google Cloud Functions are not far behind and it will be interesting to see if they can close the gap with optimisation work over the coming year – if they can get their flat our response times reduced they will probably pull level with AWS. The results are similar enough in their characteristics that my suspicion is Google and AWS have similar underlying approaches.

Unfortunately, like with the .NET scenarios, Azure is poor at handling HTTP triggered functions with very similar patterns on show. The Azure issues are not framework based but due to how they are hosting functions and handling scale. Hopefully over the next few months we’ll see some improvements that make Azure a more viable host for HTTP serverless / API approaches when latency matters.

By all means use the above as a rough guide but ultimately whatever platform you choose I’d encourage you to build out the smallest representative vertical slice of functionality you can and test it.

Thanks for reading – hopefully this data is useful.

Azure Functions vs AWS Lambda – Scaling Face Off

Since I published this piece Microsoft have made significant improvements to HTTP scaling on Azure Functions and the below is out of date. Please see this post for a revised comparison.

If you’ve been following my blog recently you’ll know I’ve been spending a lot of time with the Azure Functions – Microsoft’s implementation of a serverless platform. The idea behind serverless appeals to me massively and seems like the natural next evolution of compute on the cloud with scaling and pricing being, so the premise goes, fully dynamic and consumption based.

The use of App Service Plans (more later) as a host mechanism for Azure Functions gave me some concern about how “serverless” Azure Functions might actually be and so to verify suitability for my use cases I’ve been running a range of different tests around response time and latency that culminated in the “real” application I described in my last blog post and some of the performance tests I ran along the way. I quickly learned that the hosting implementation is not particularly dynamic and so wanted to run comparable tests on AWS Lambda.

To do this I’ve ported the serverless blog over to AWS Lambda, S3 and DynamoDB (the, rather scruffy, code is in a branch on GitHub – I will tidy this up but the aim was to get the tests running) and then I’ve run a number of user volume scenarios against a single test case: loading the homepage. The operations involved in this are:

  1. A GET request to a serverless HTTP endpoint that:
    1. Loads 3 resources from storage (Blob Storage on Azure, S3 on AWS) in an asynchronous batch.
    2. Combines them together using a Handlebars template
    3. Returns the response as a string of type text/html.

On Azure I’m using .NET 4.6 on the v1 runtime while on AWS I’m using the same code running under .NET Core 1.0. It’s worth noting that latency on blob access remained minimal throughout all these tests (6ms on average across all loads) and when removing blob access from the tests it made little difference to the patterns.

Although the .NET 4.6 and Core runtimes are different (and accepted may exhibit different behaviours) these are the current general availability options for implementing serverless on the two platforms using .NET and both vendors claim full support for them. In Microsoft’s case some of the languages supported on the v1 Azure Functions runtime, the one tested here (v2 is in preview and has serious performance issues with .NET Core), are experimental and documented as having scale problems but C# (which runs under full framework .NET) is not one of them. Both vendors have .NET Core 2.0 support on the way and in preview but given the issues I’m waiting until they go on general availability until I compare them.

The results are, frankly, pretty damning when it comes to Azure Functions ability to scale dynamically and so let’s get into the data and then look at why.

A quick note on the graphs: I’ve pulled these from VSTS, it’s quite hard (or at least I don’t know how to!) equalise the scales and so please do look at the numbers carefully – the difference is quite startling.

Add 2 Users per Second

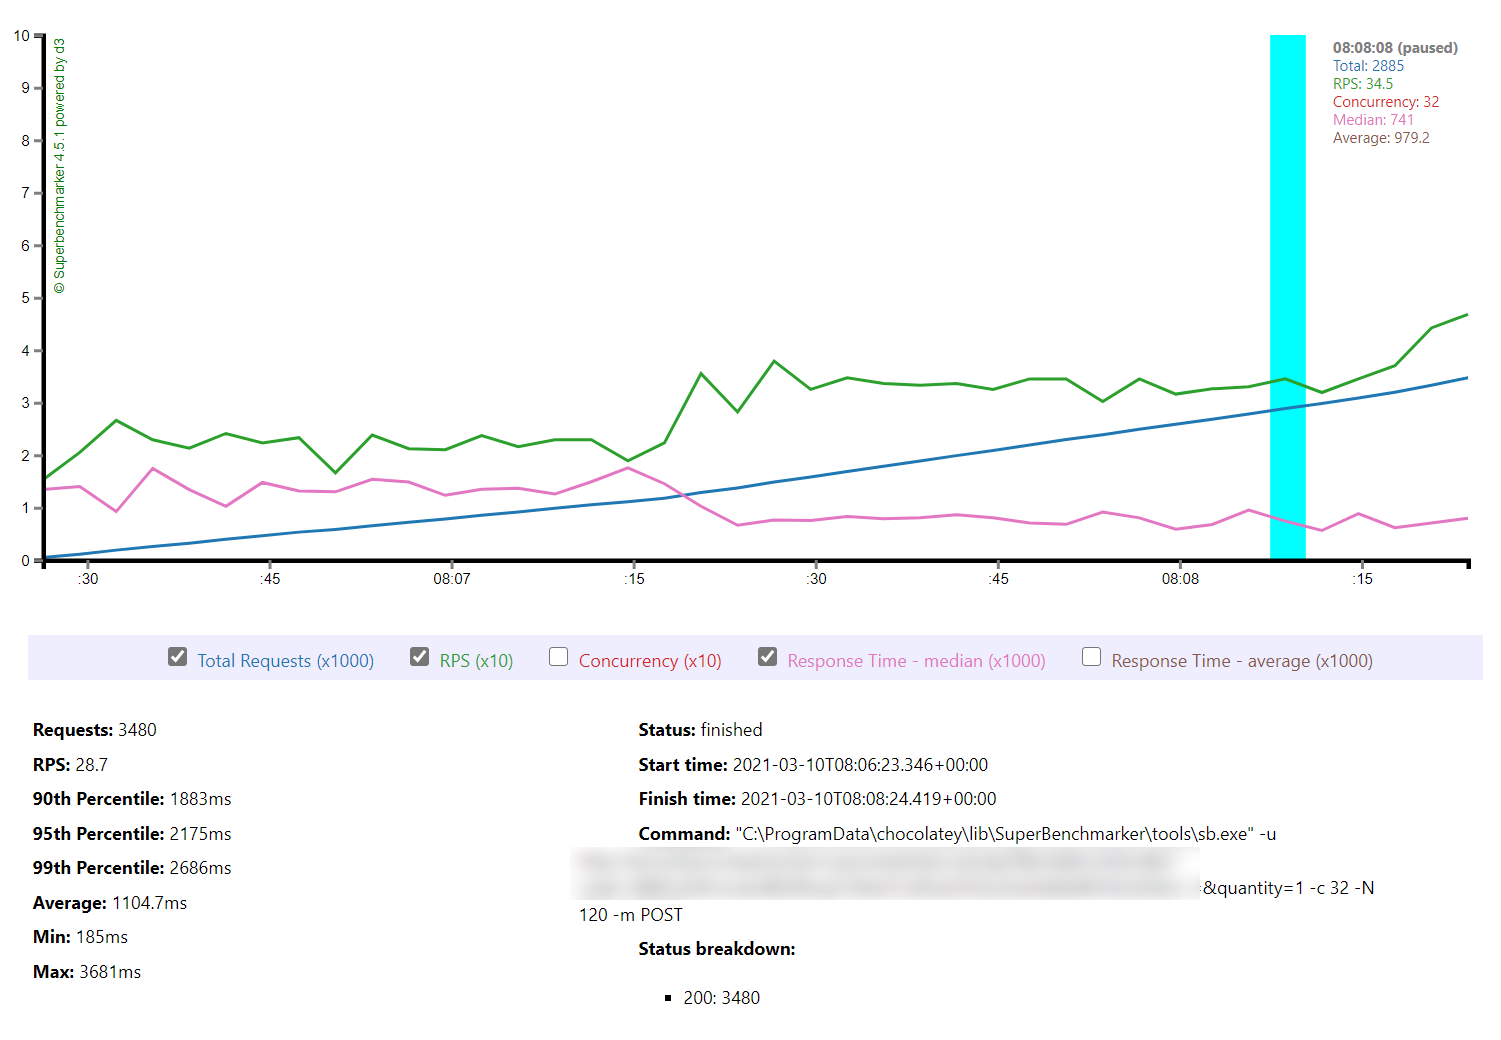
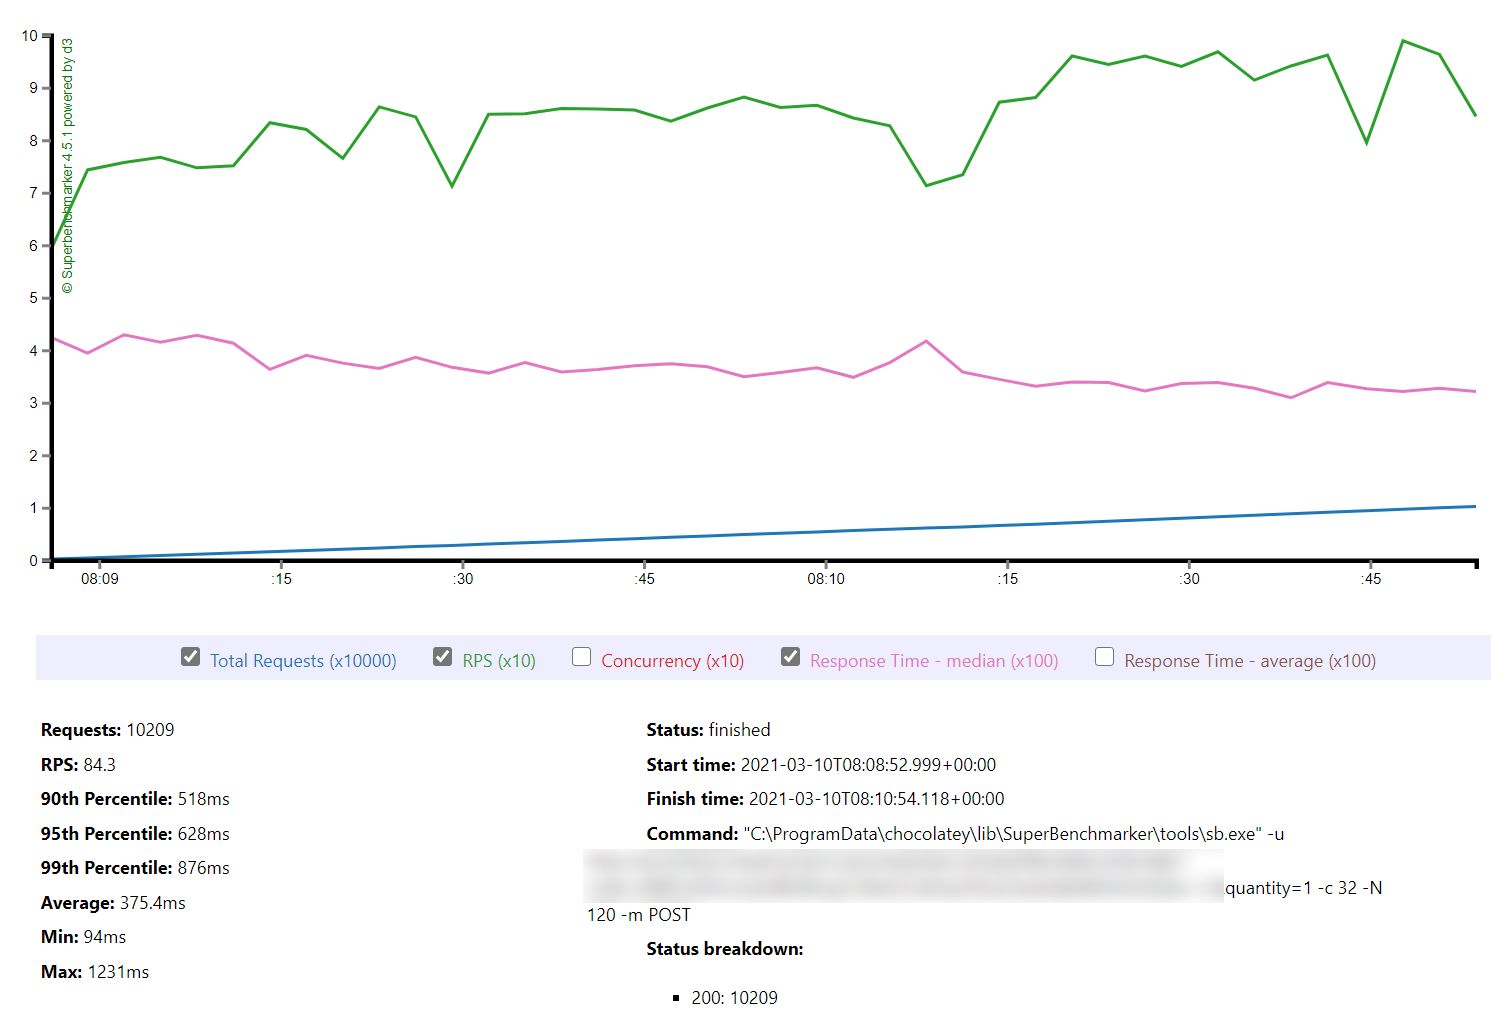
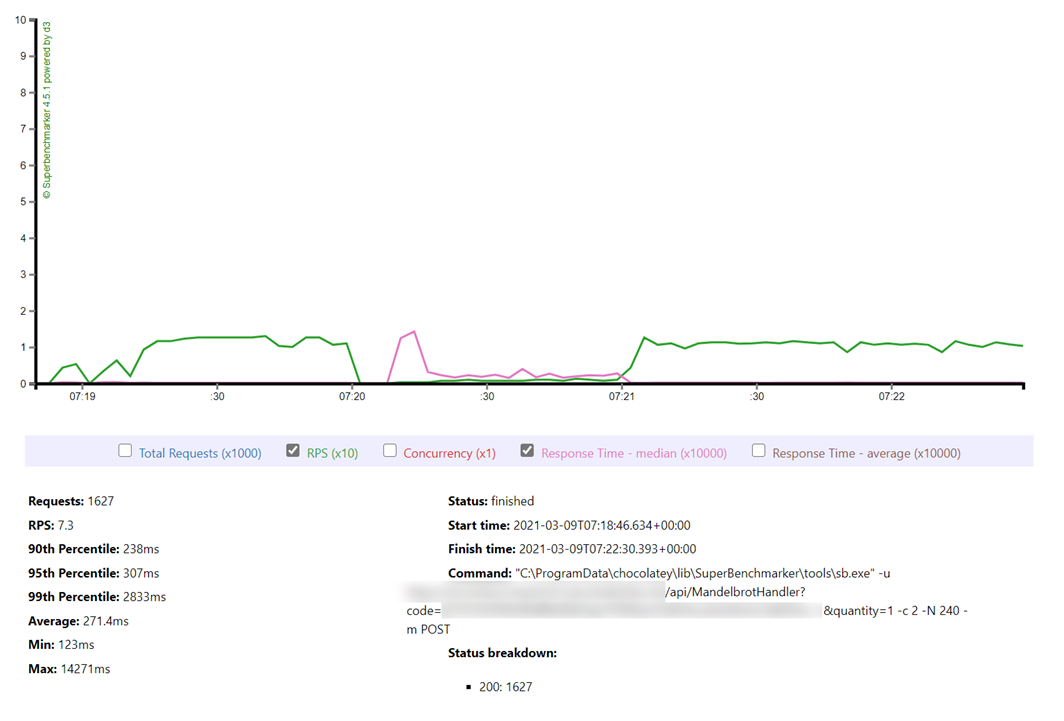
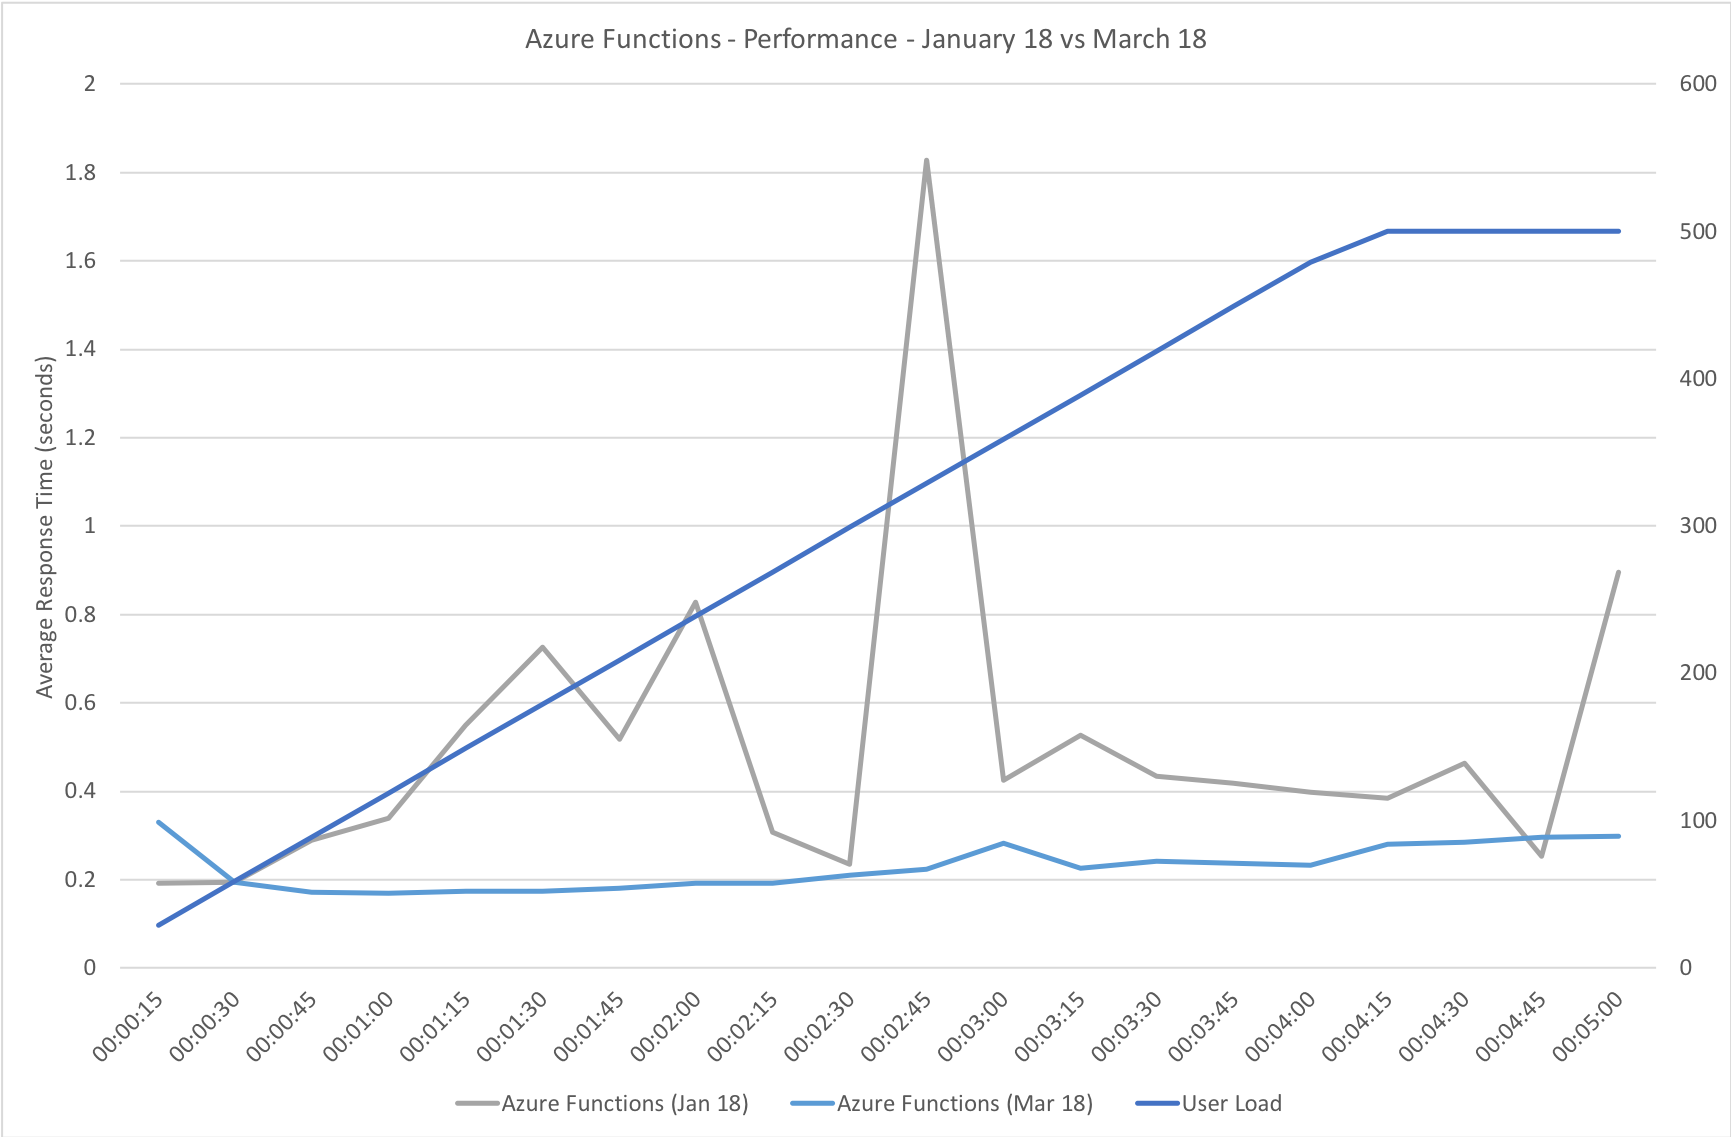
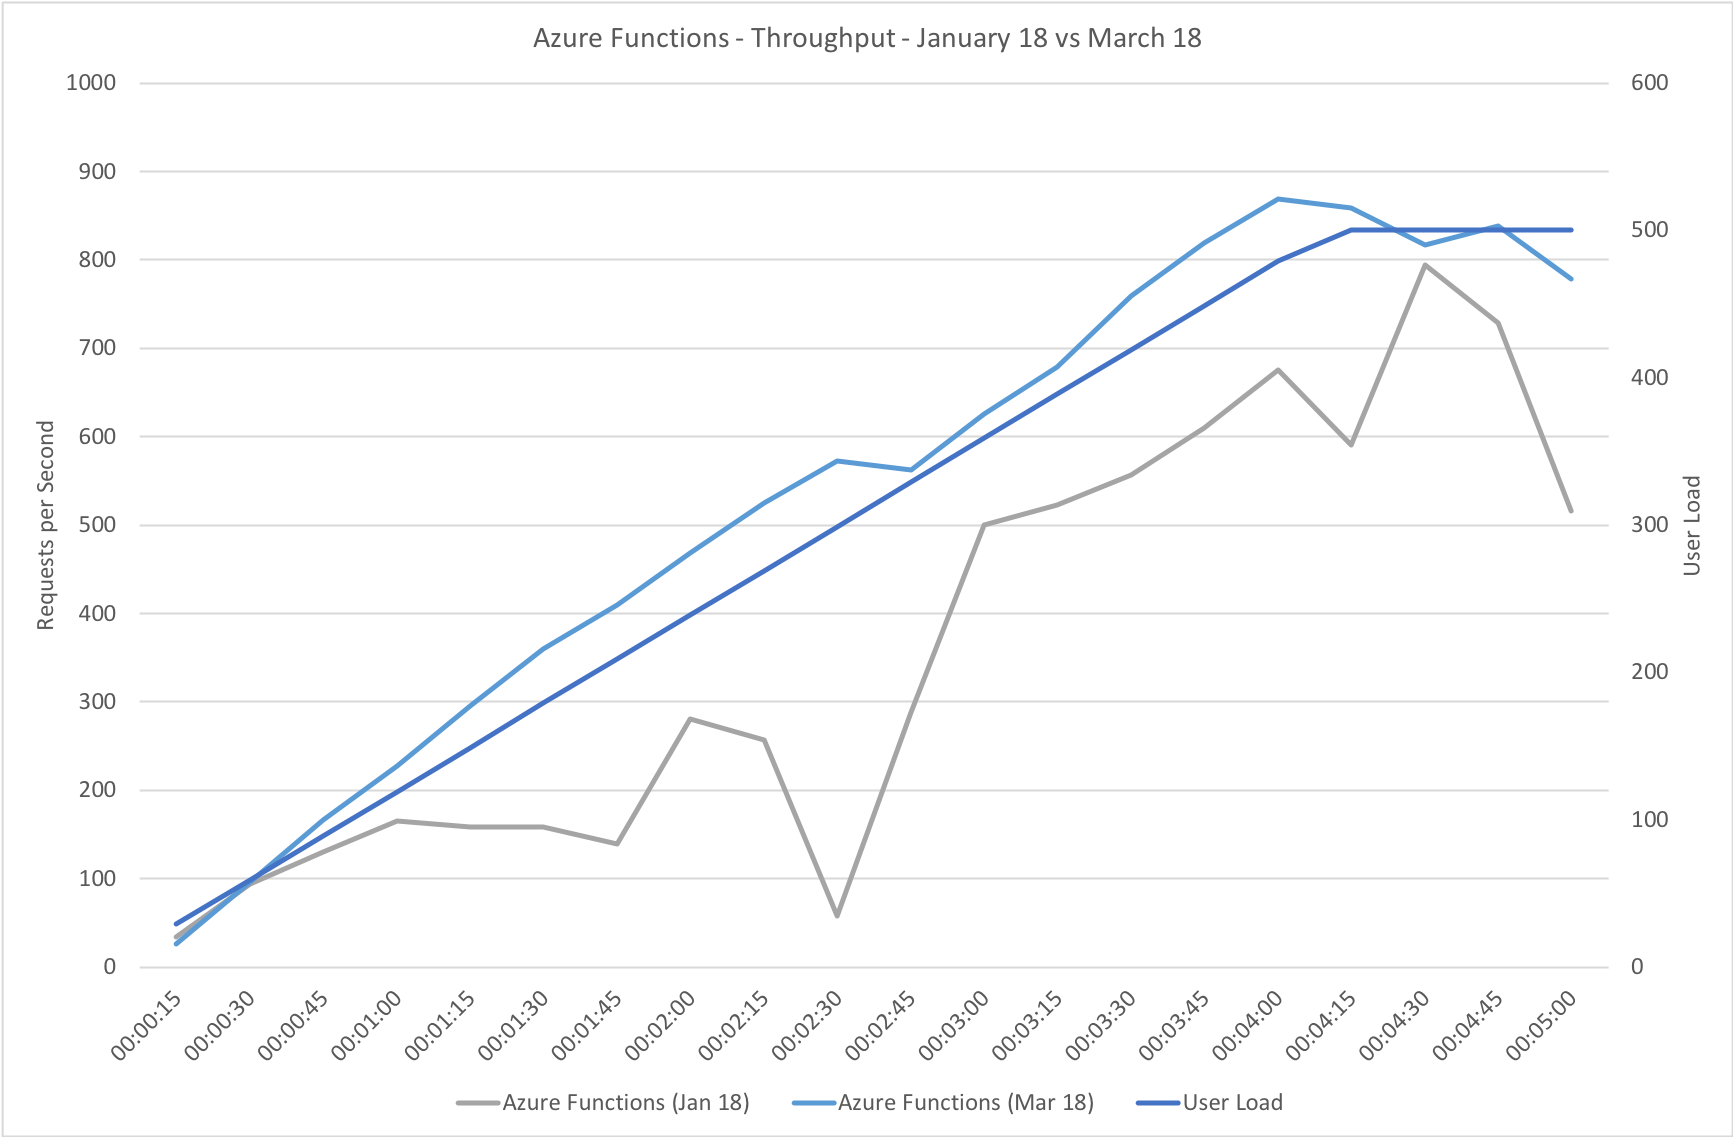
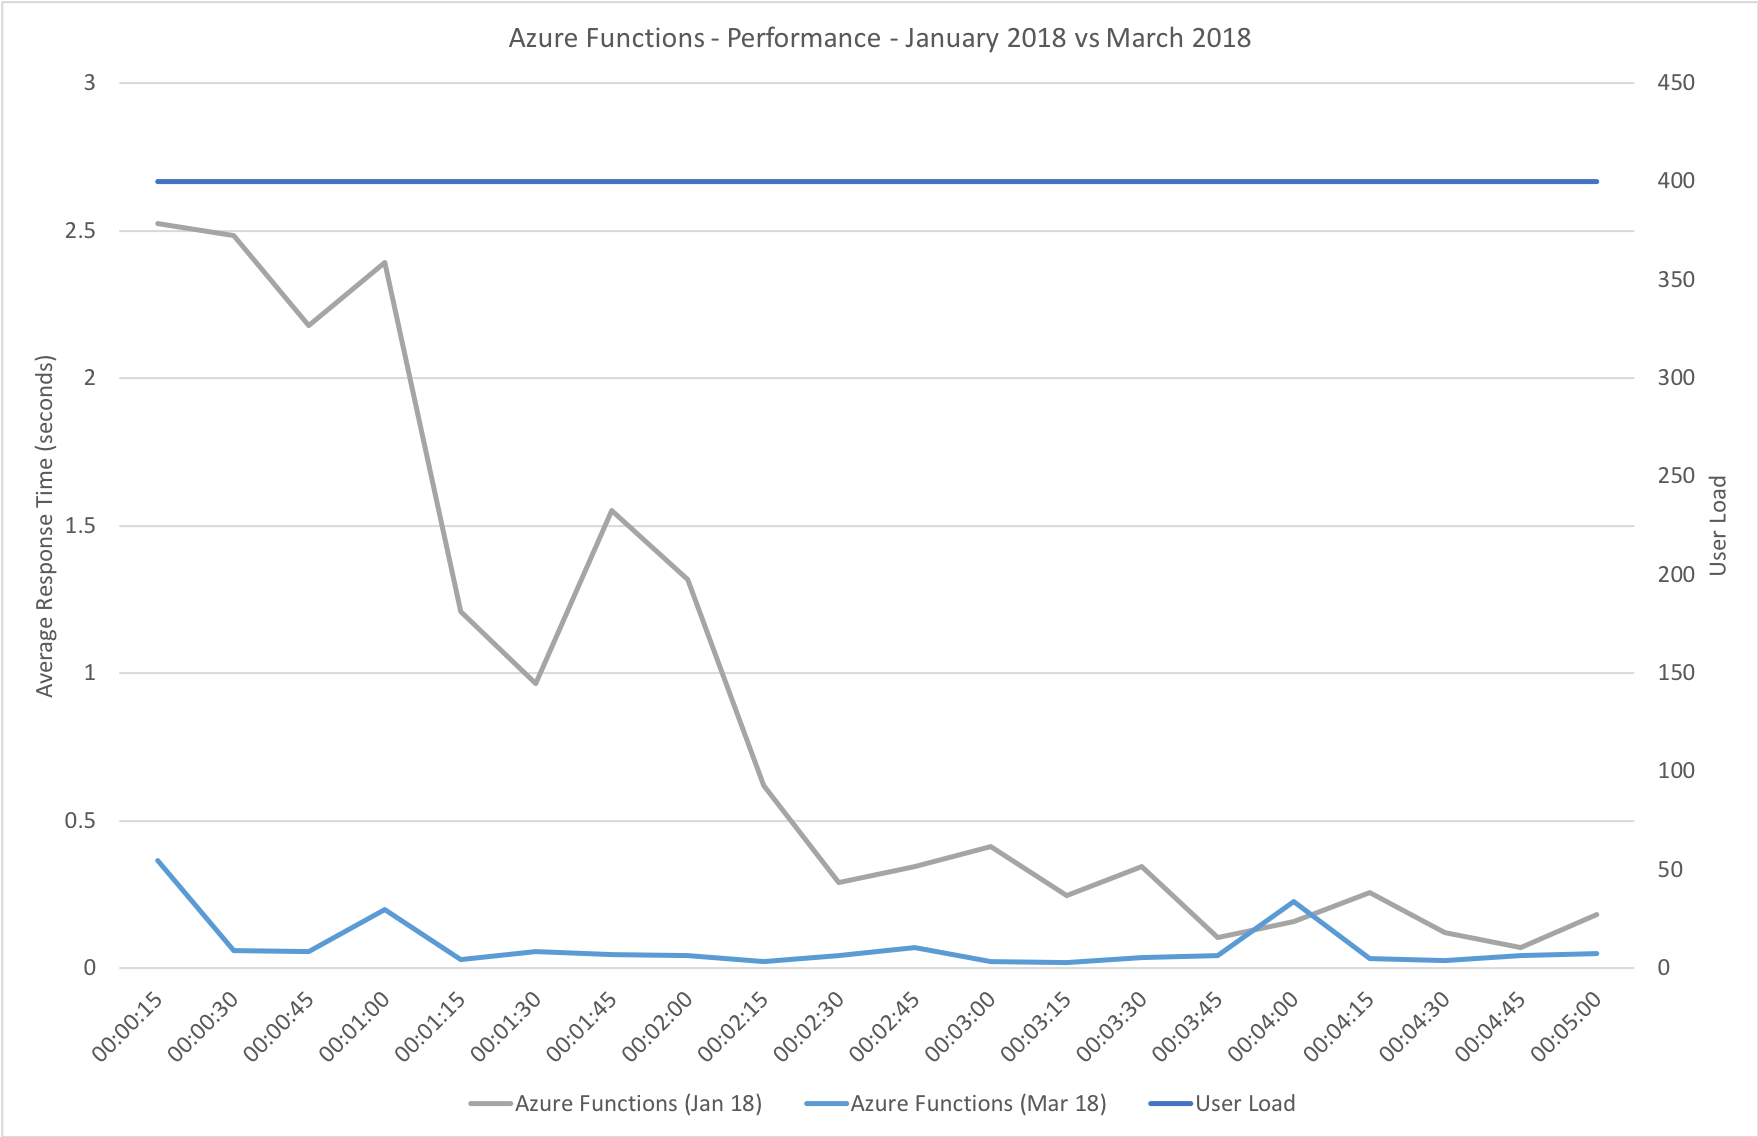
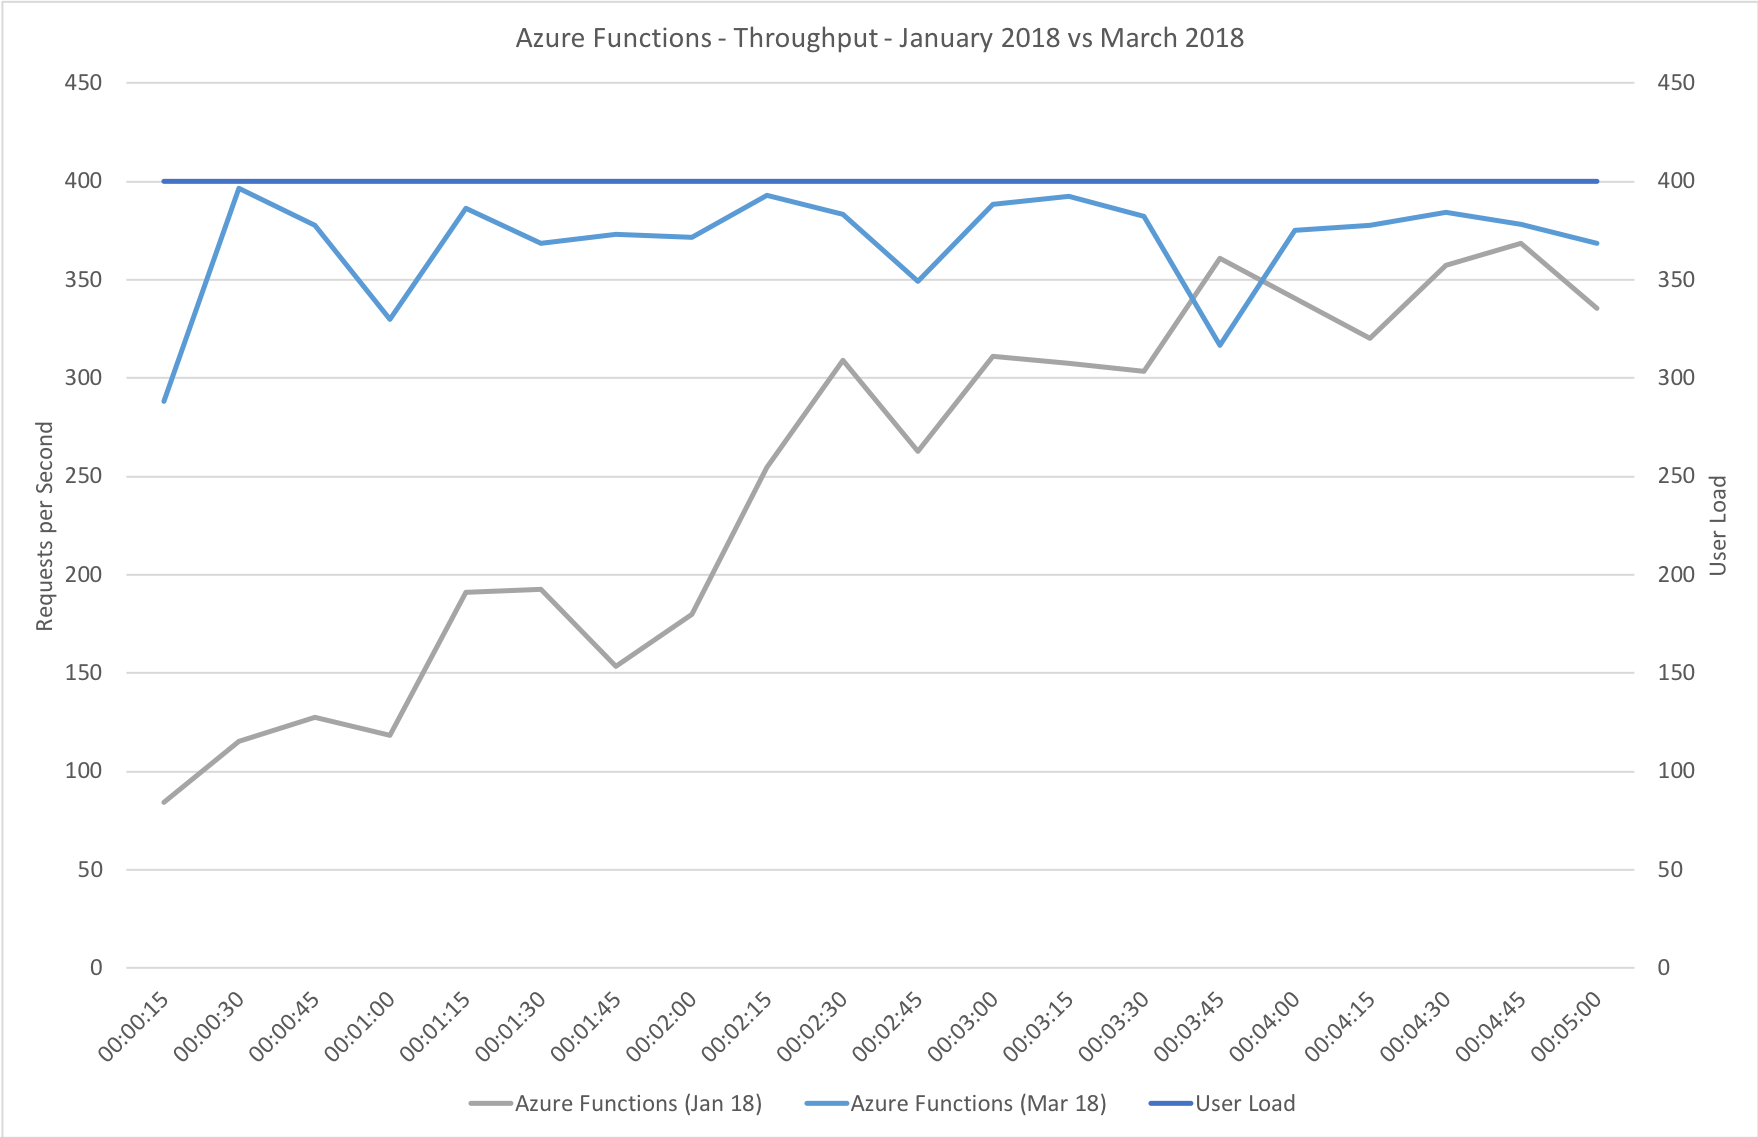
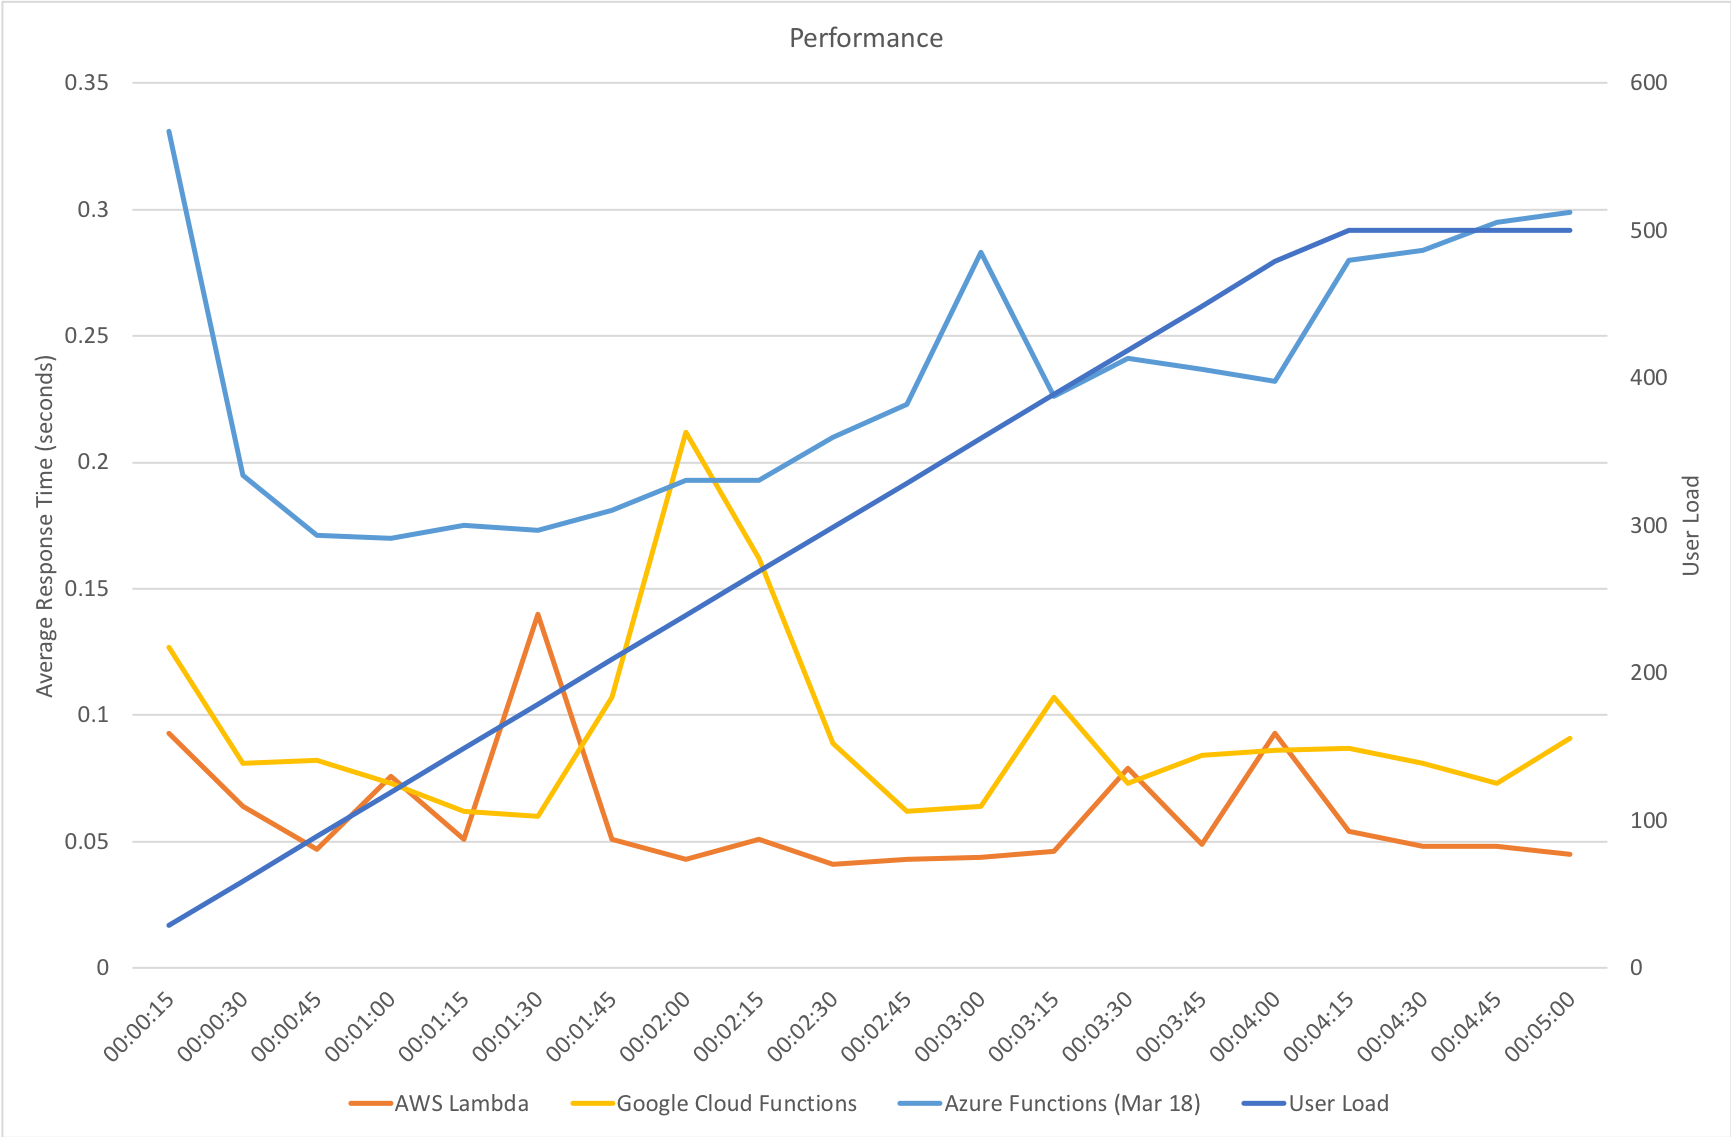
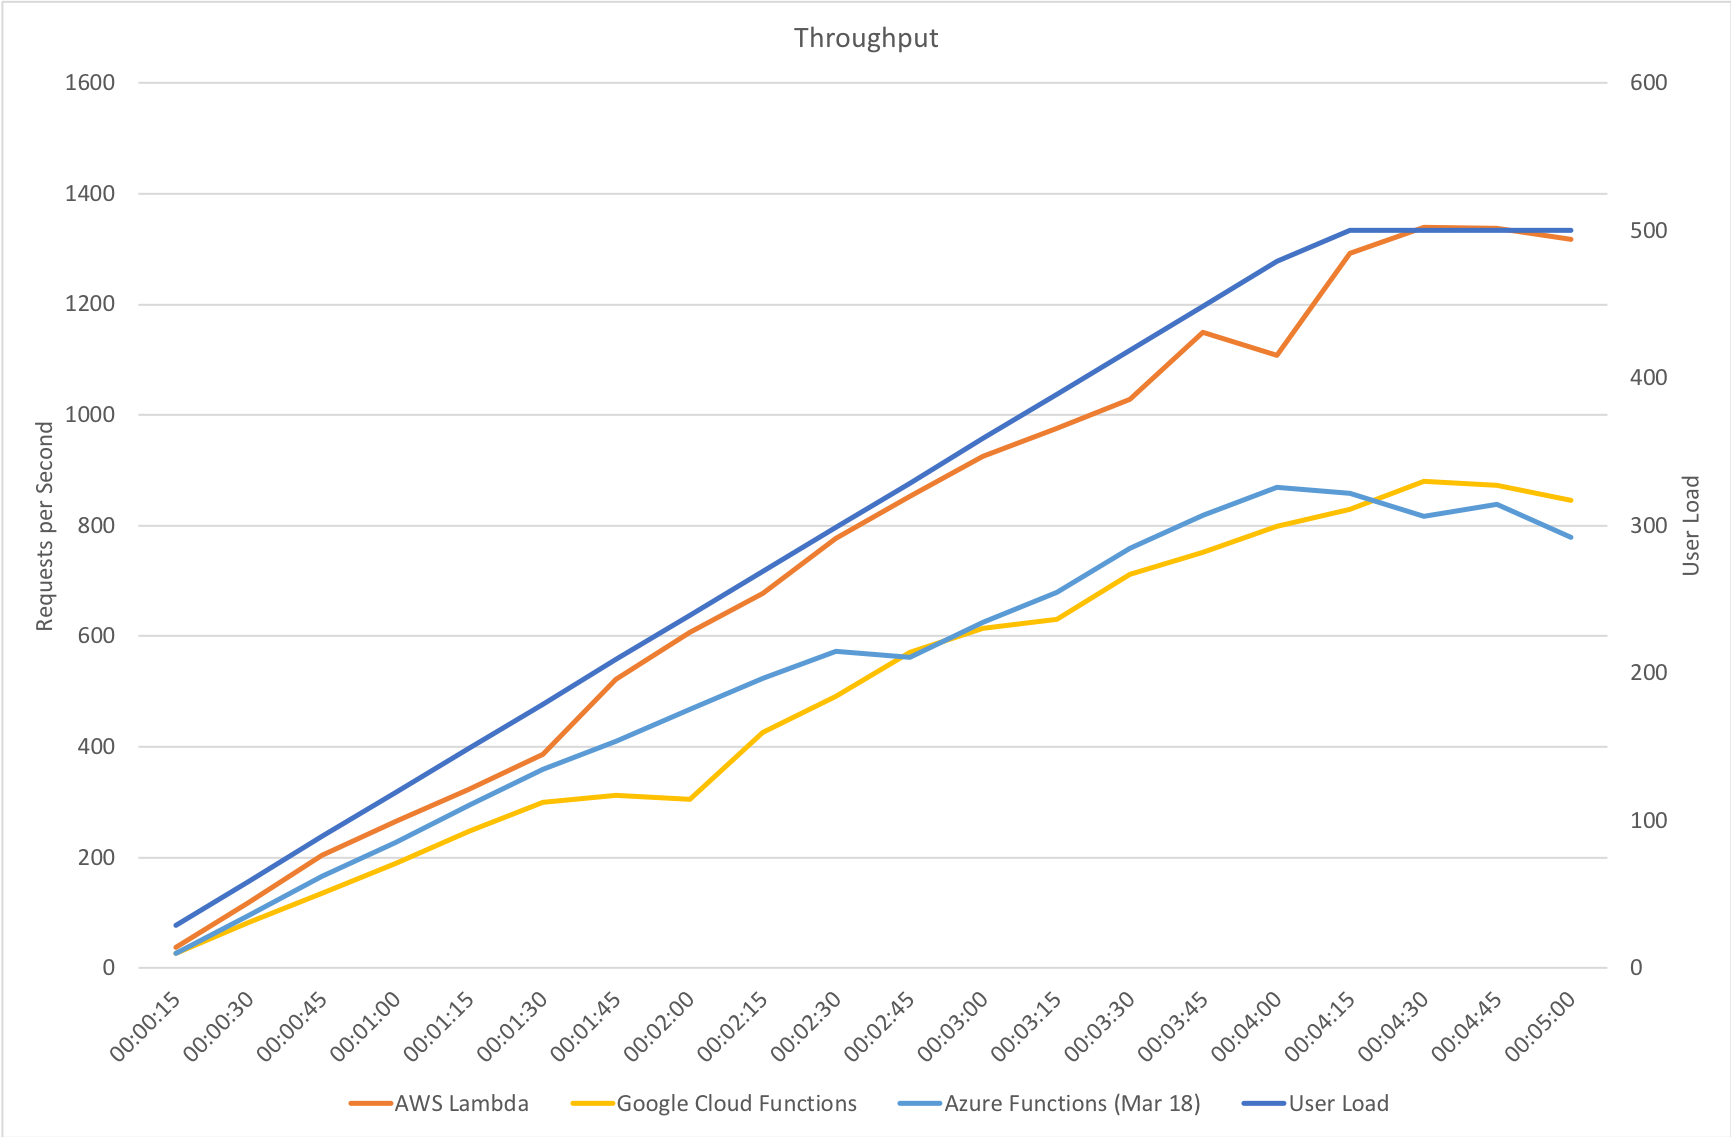
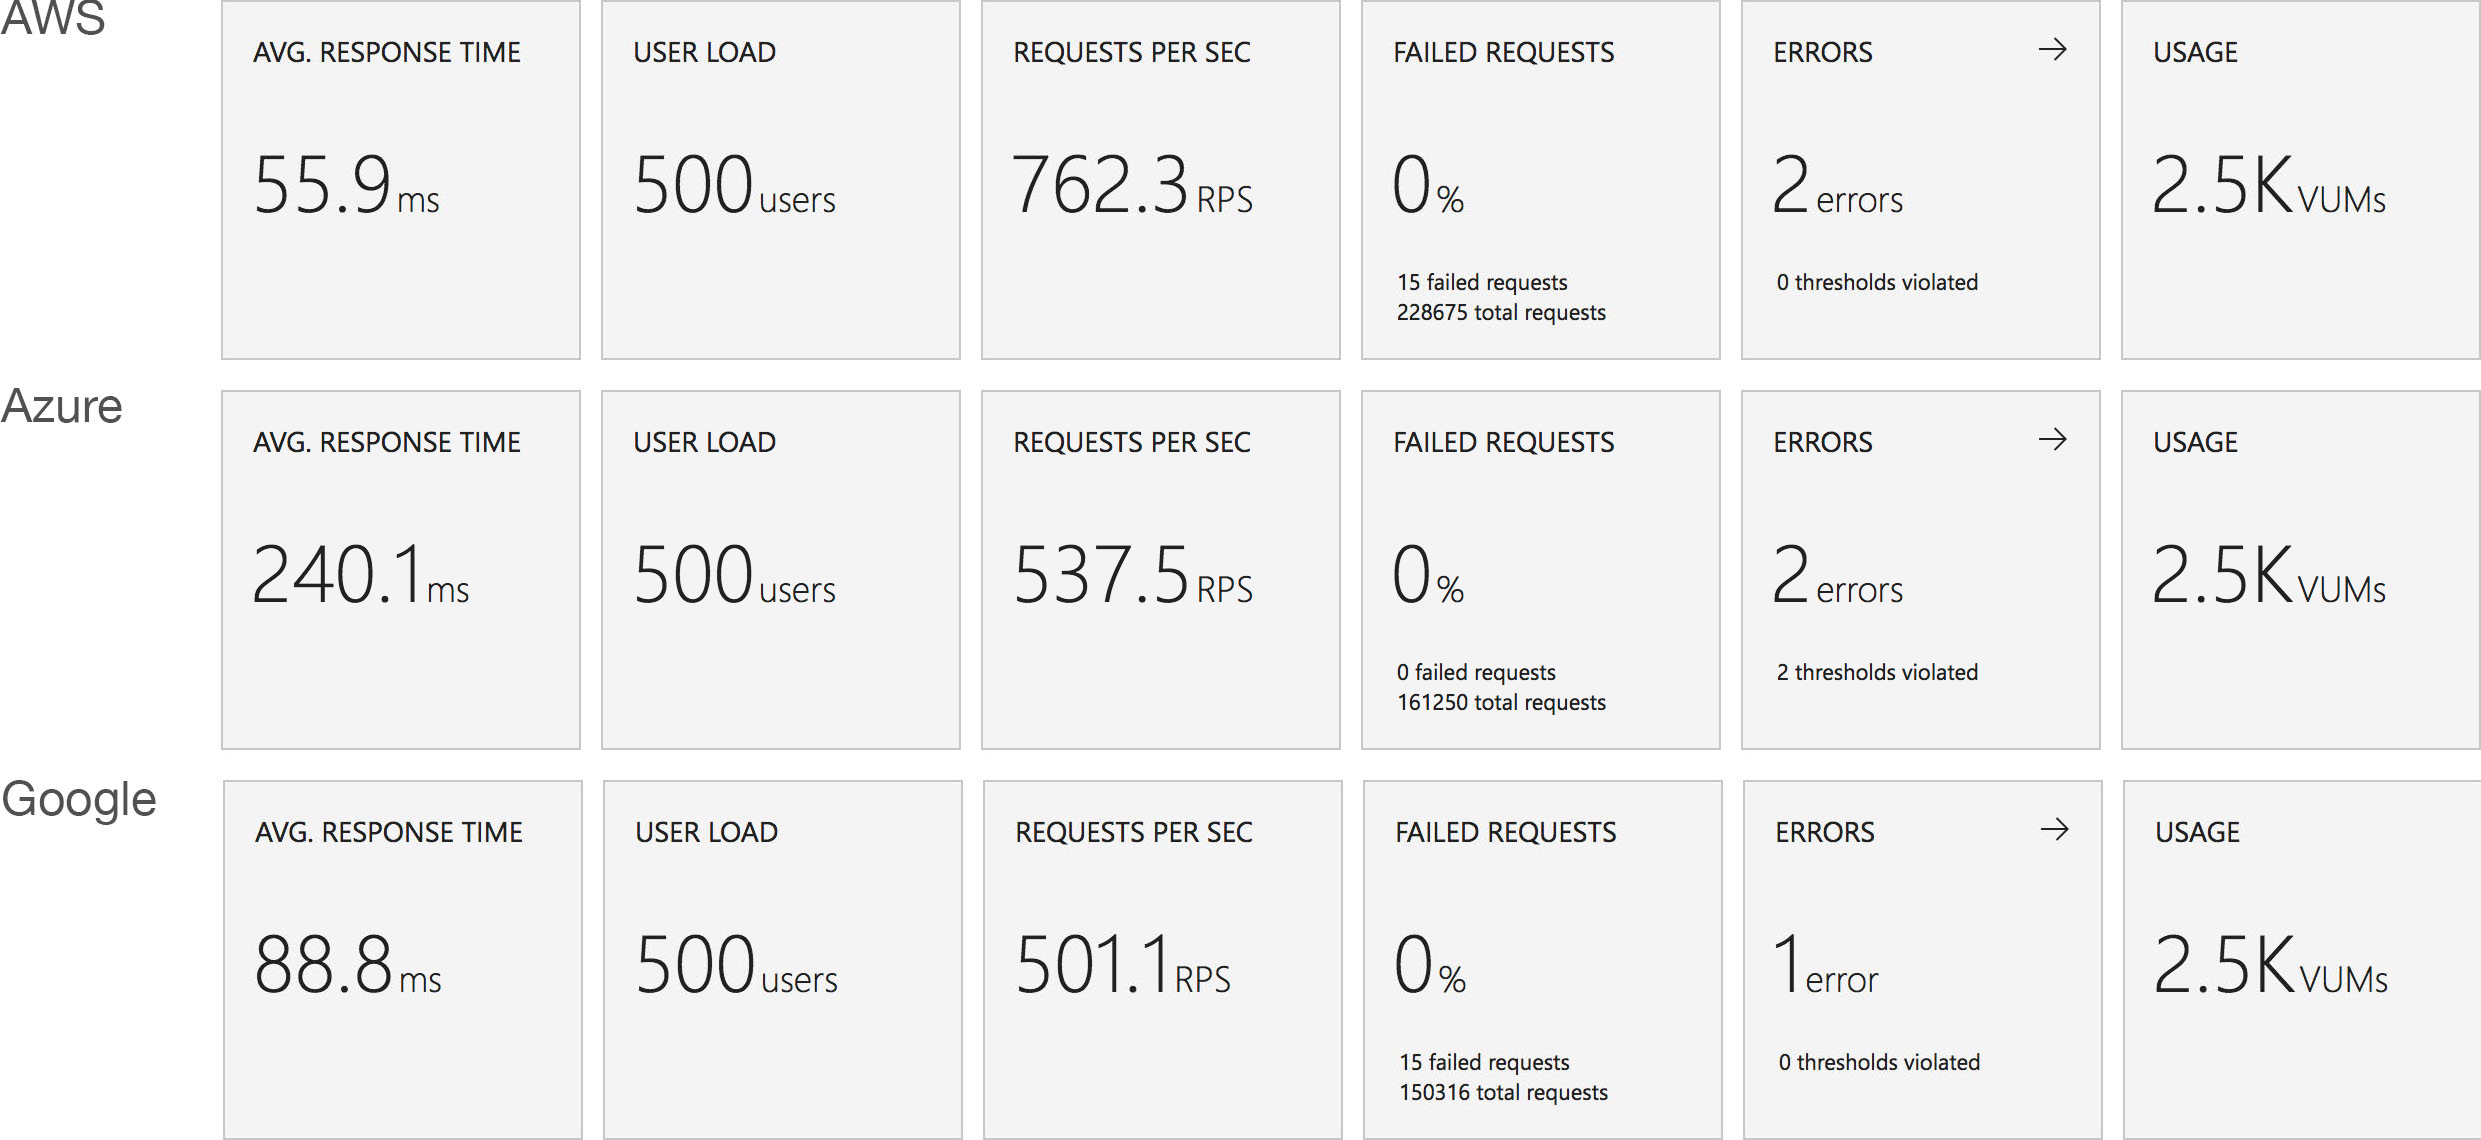
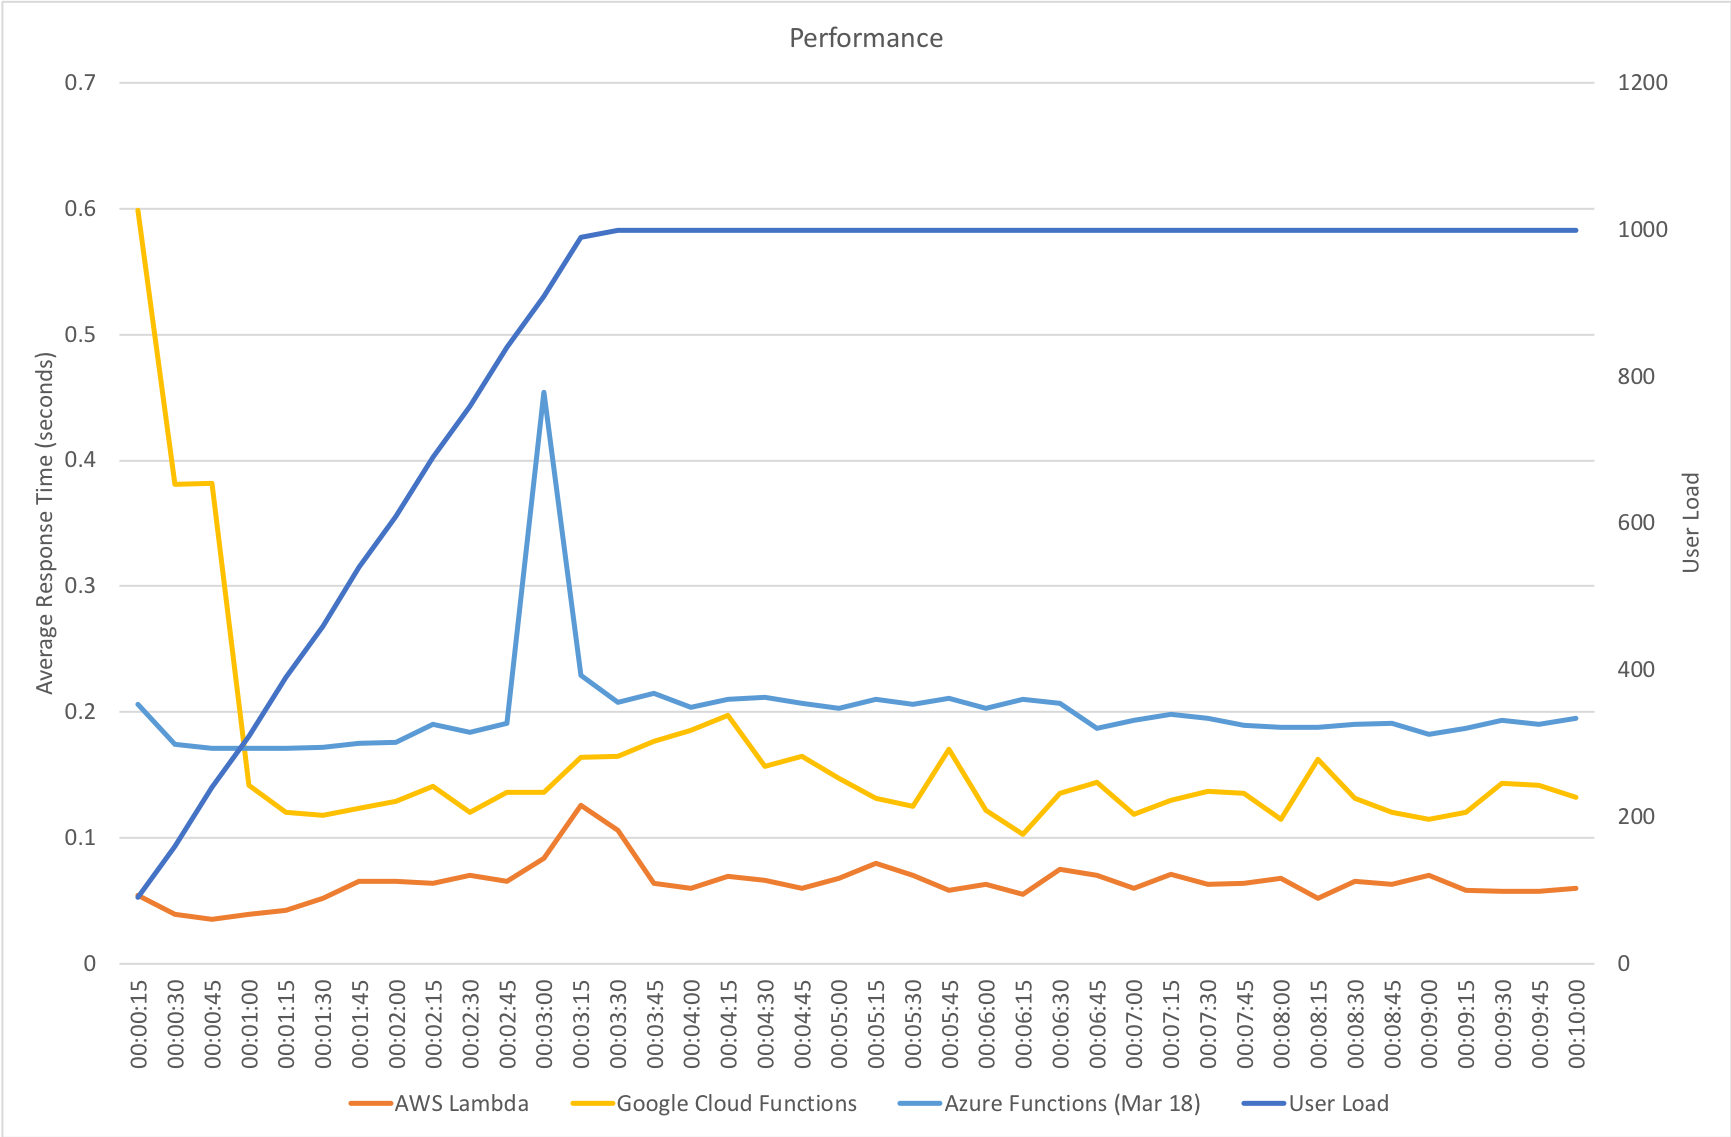
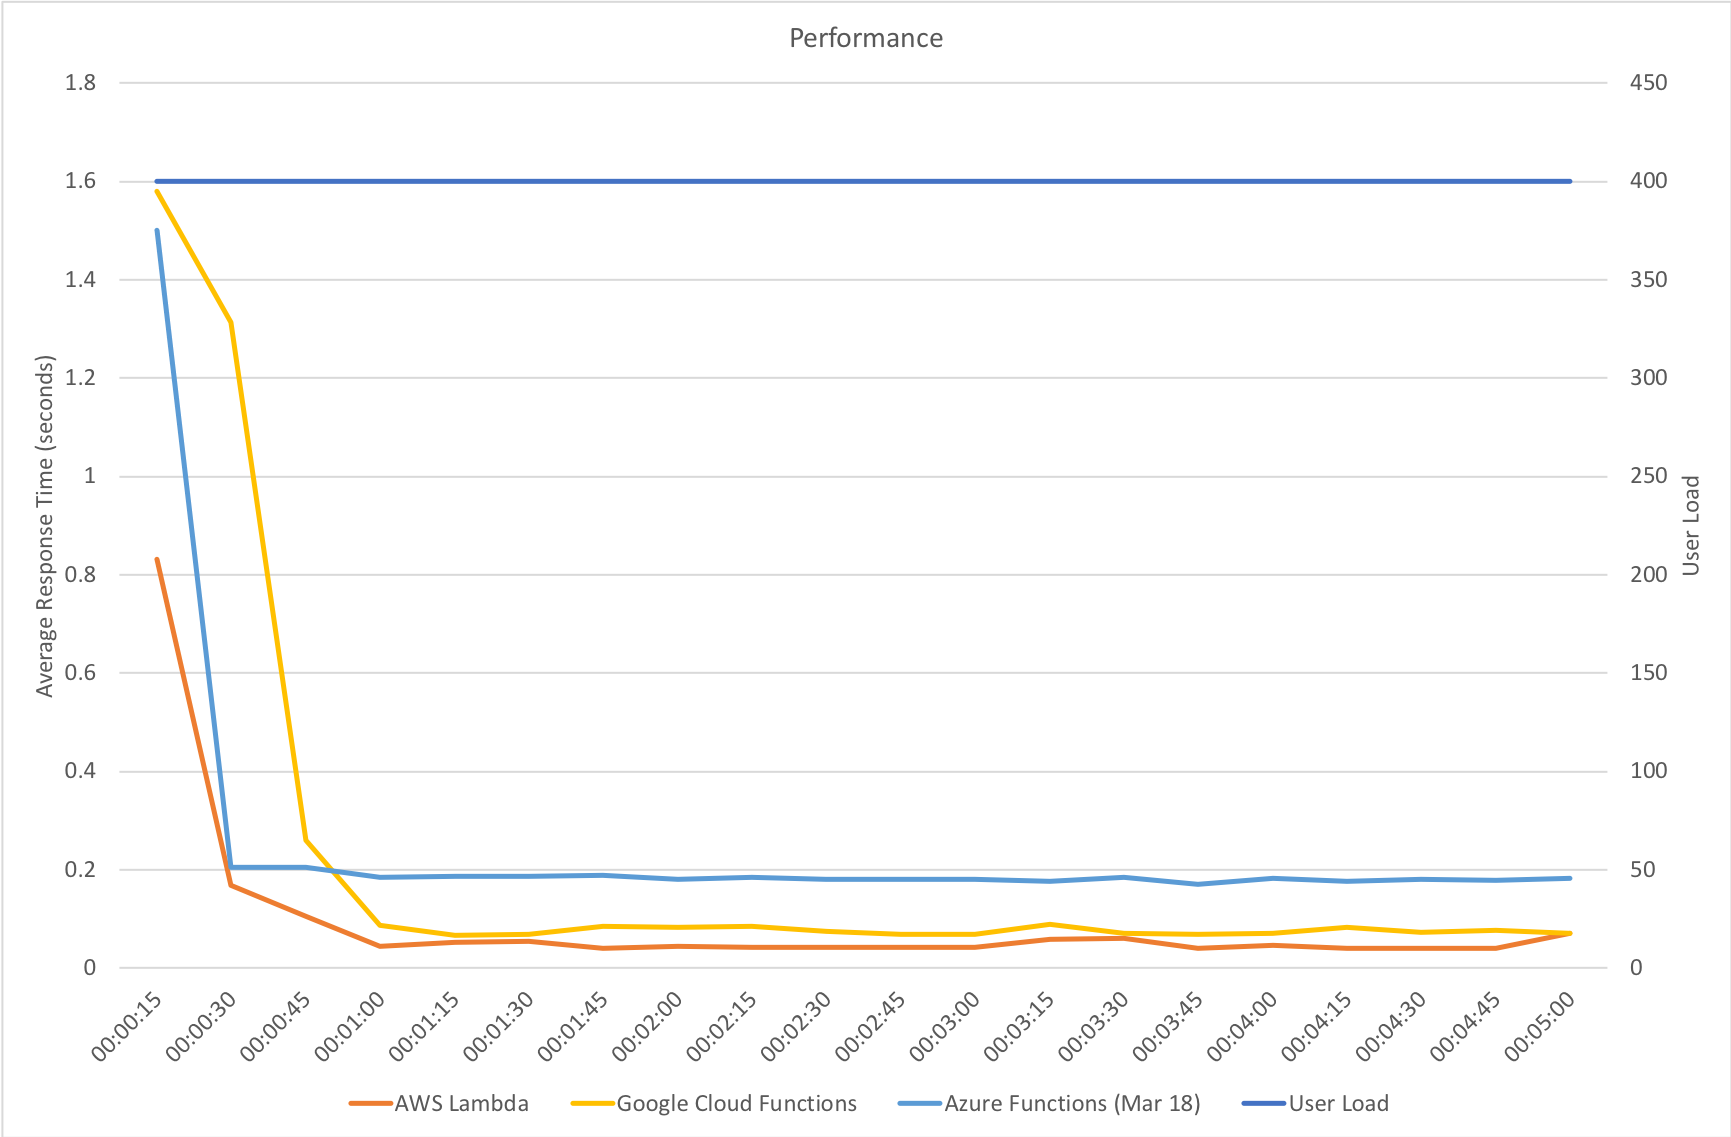
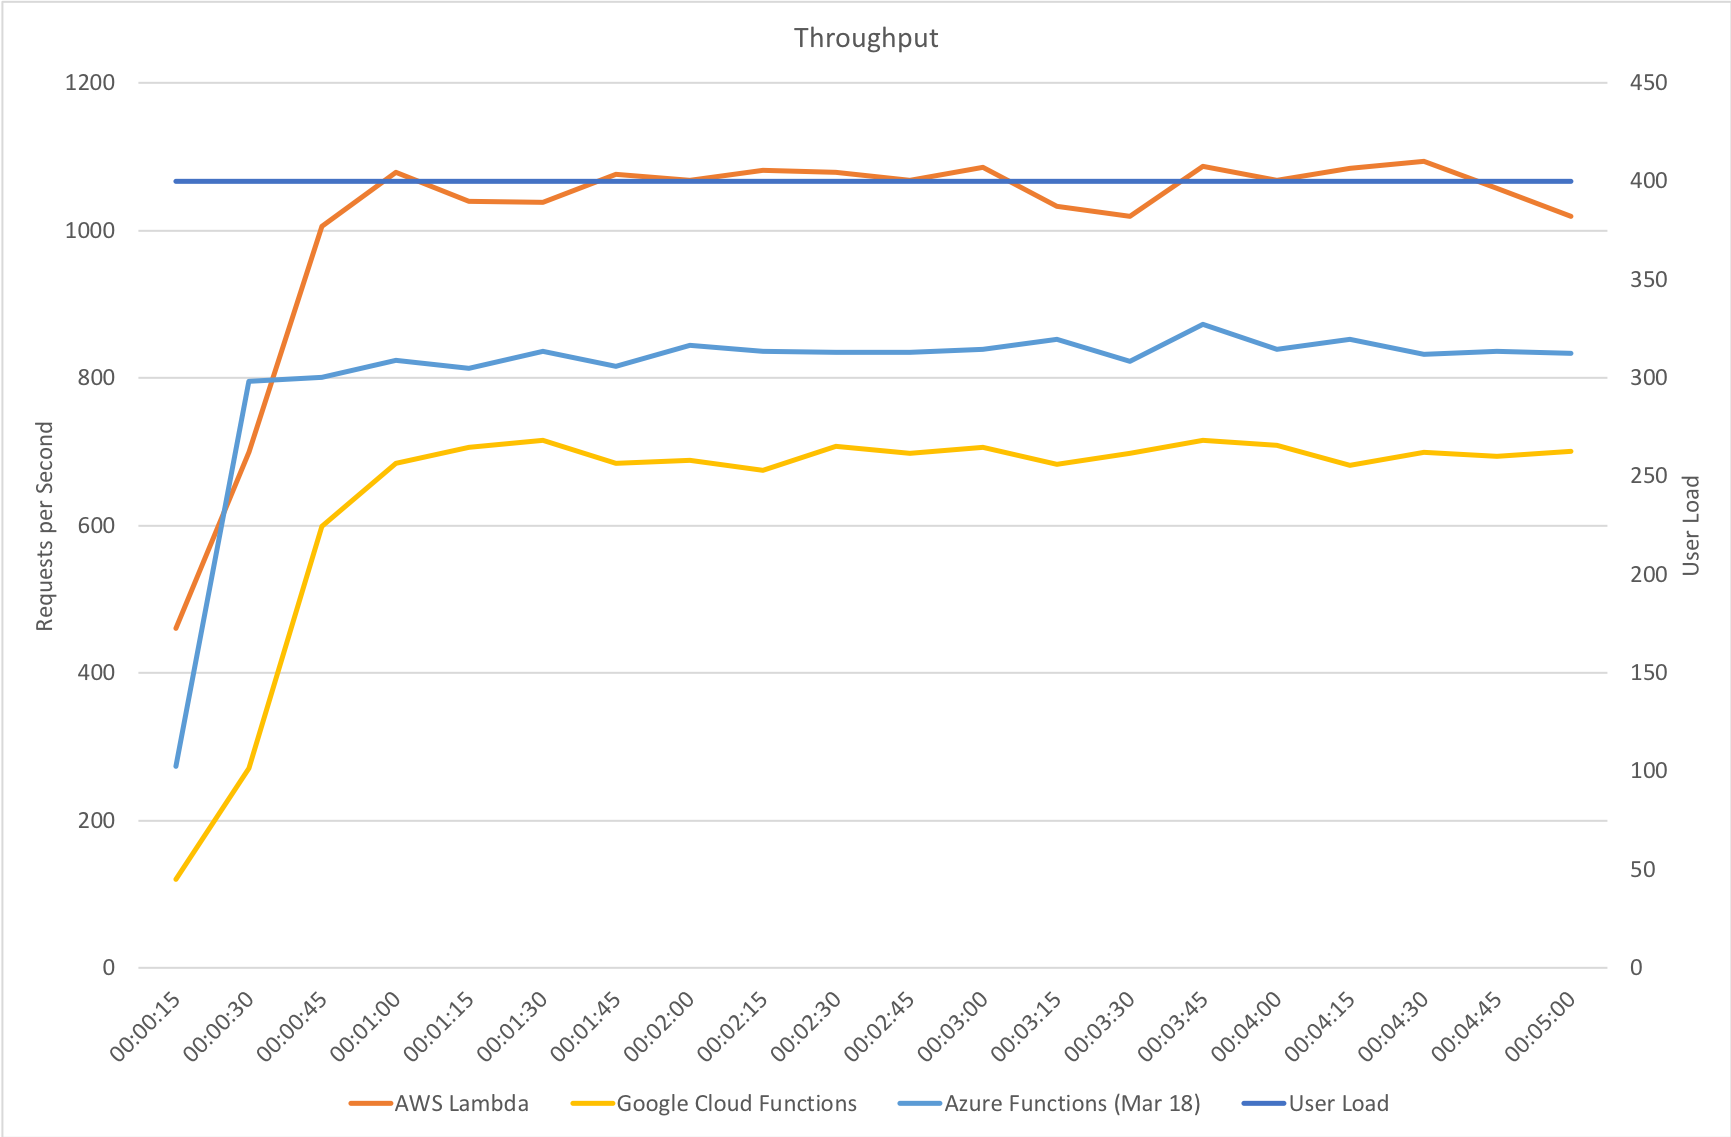
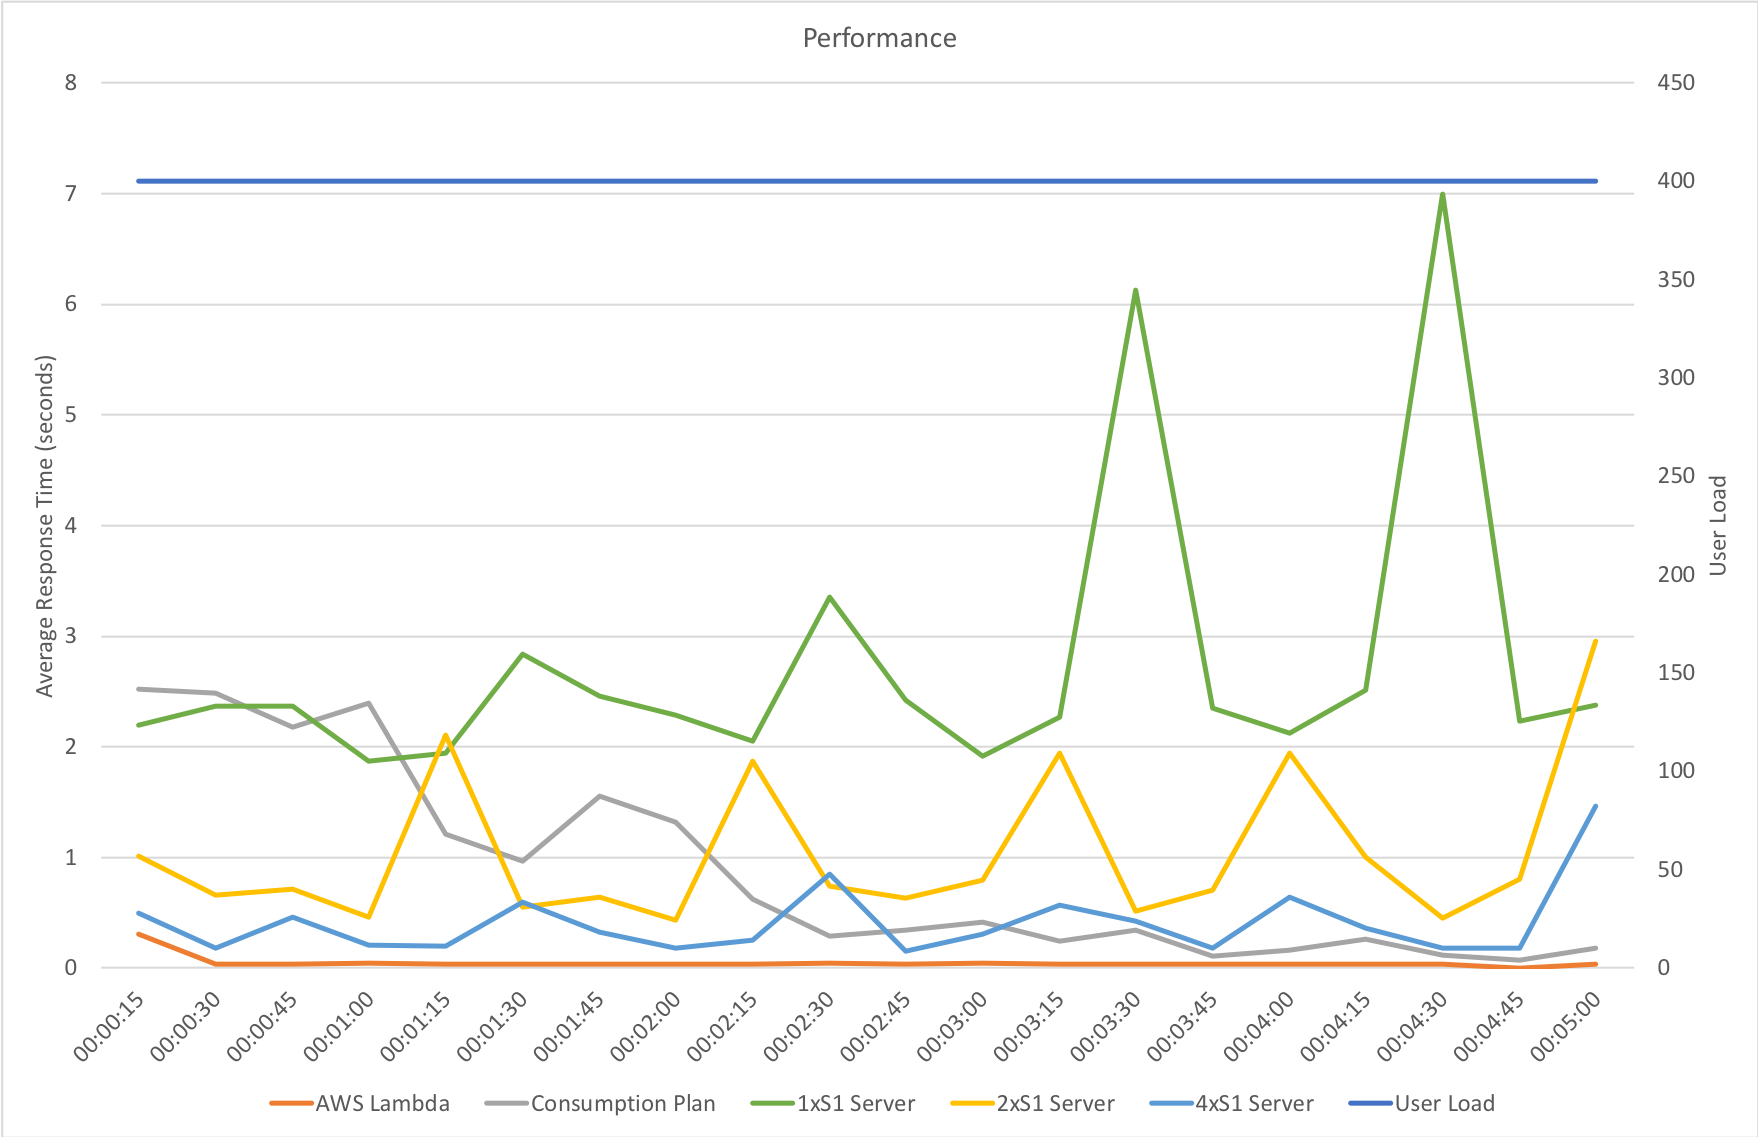
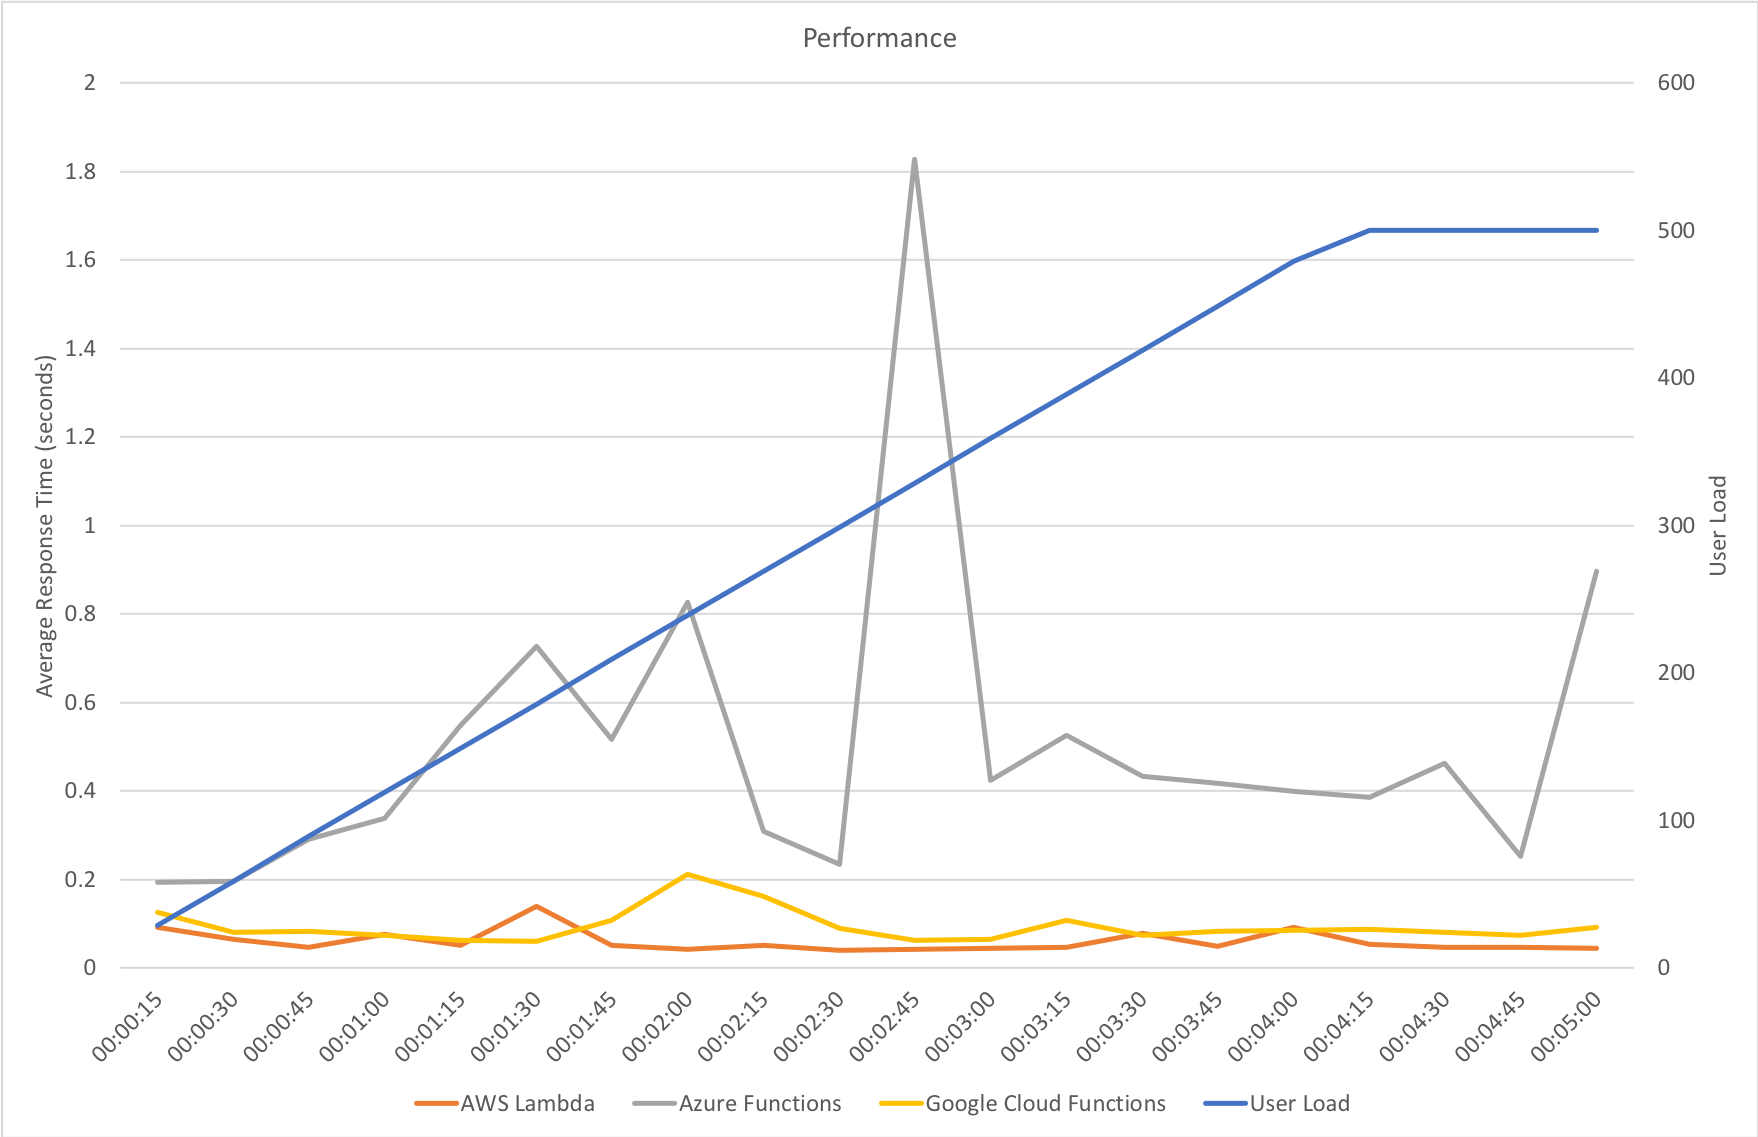
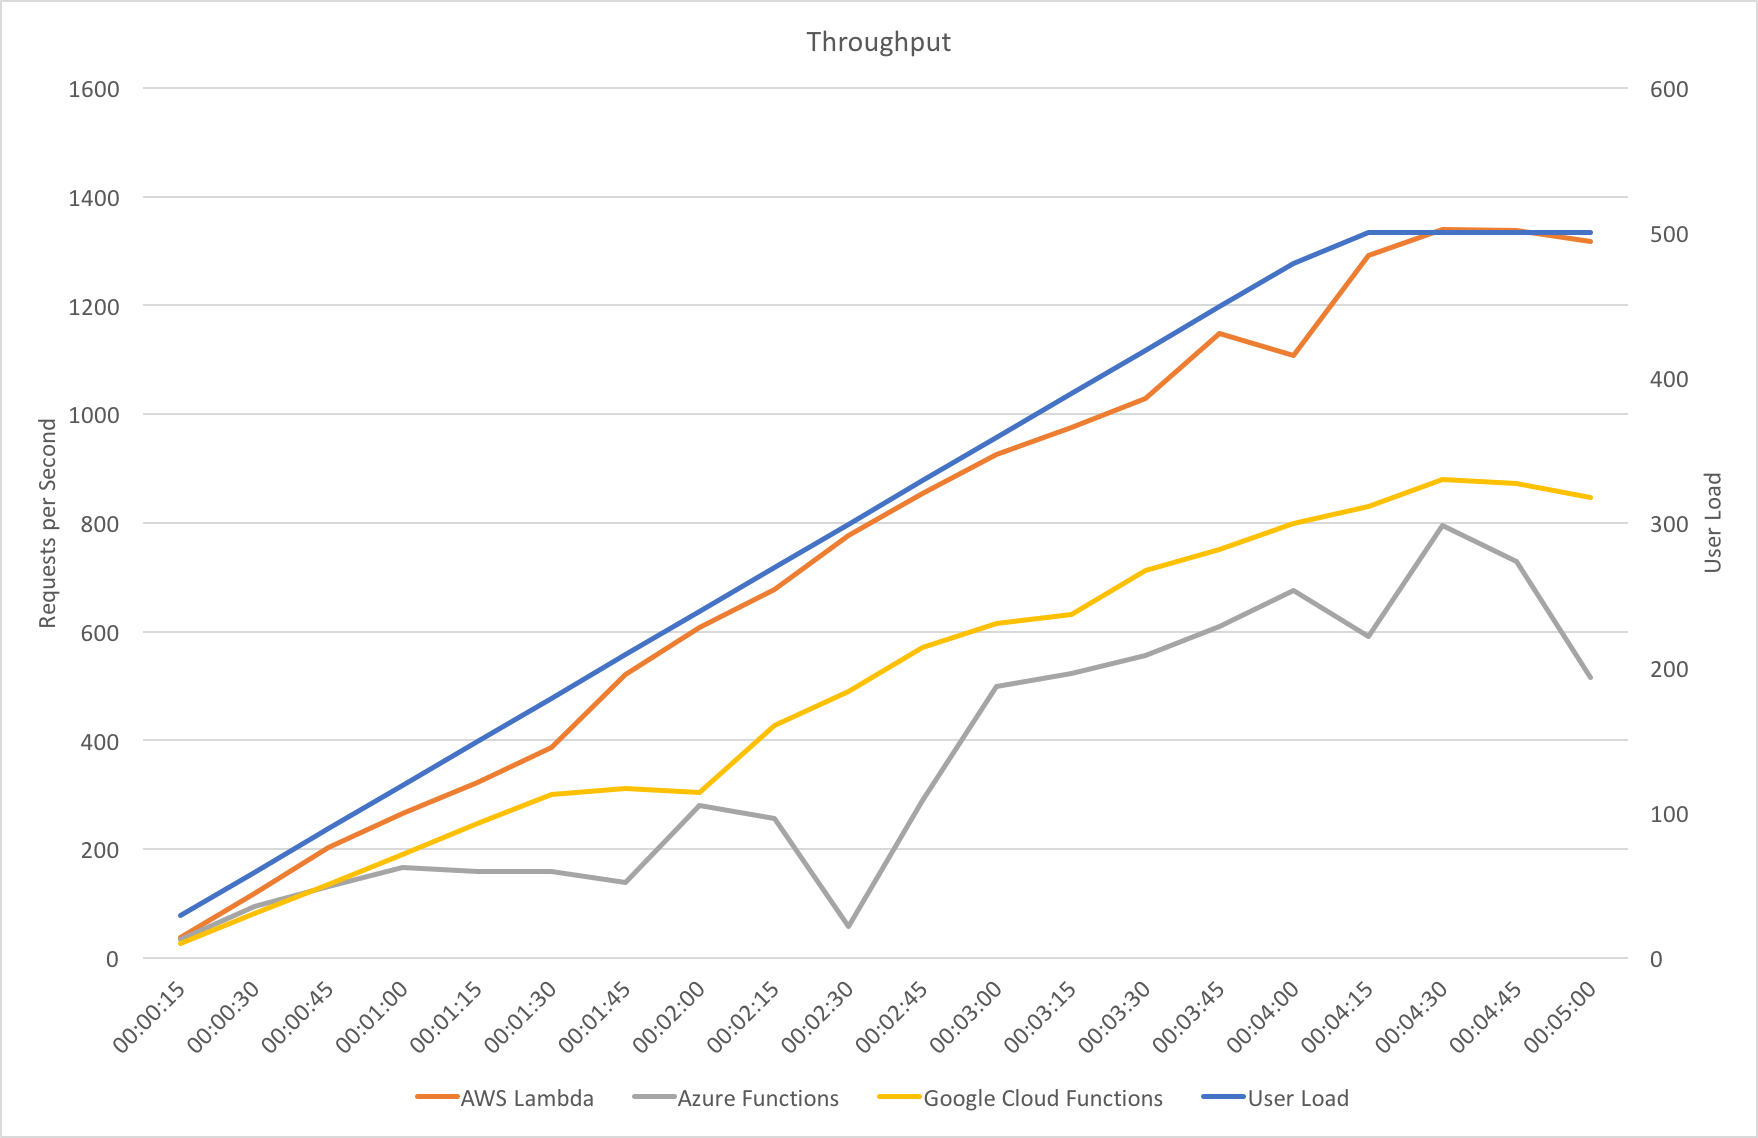
In this test scenario I’ve started with a single user and then added 2 users per second over a 5 minutes run time up to a maximum of 500 users:

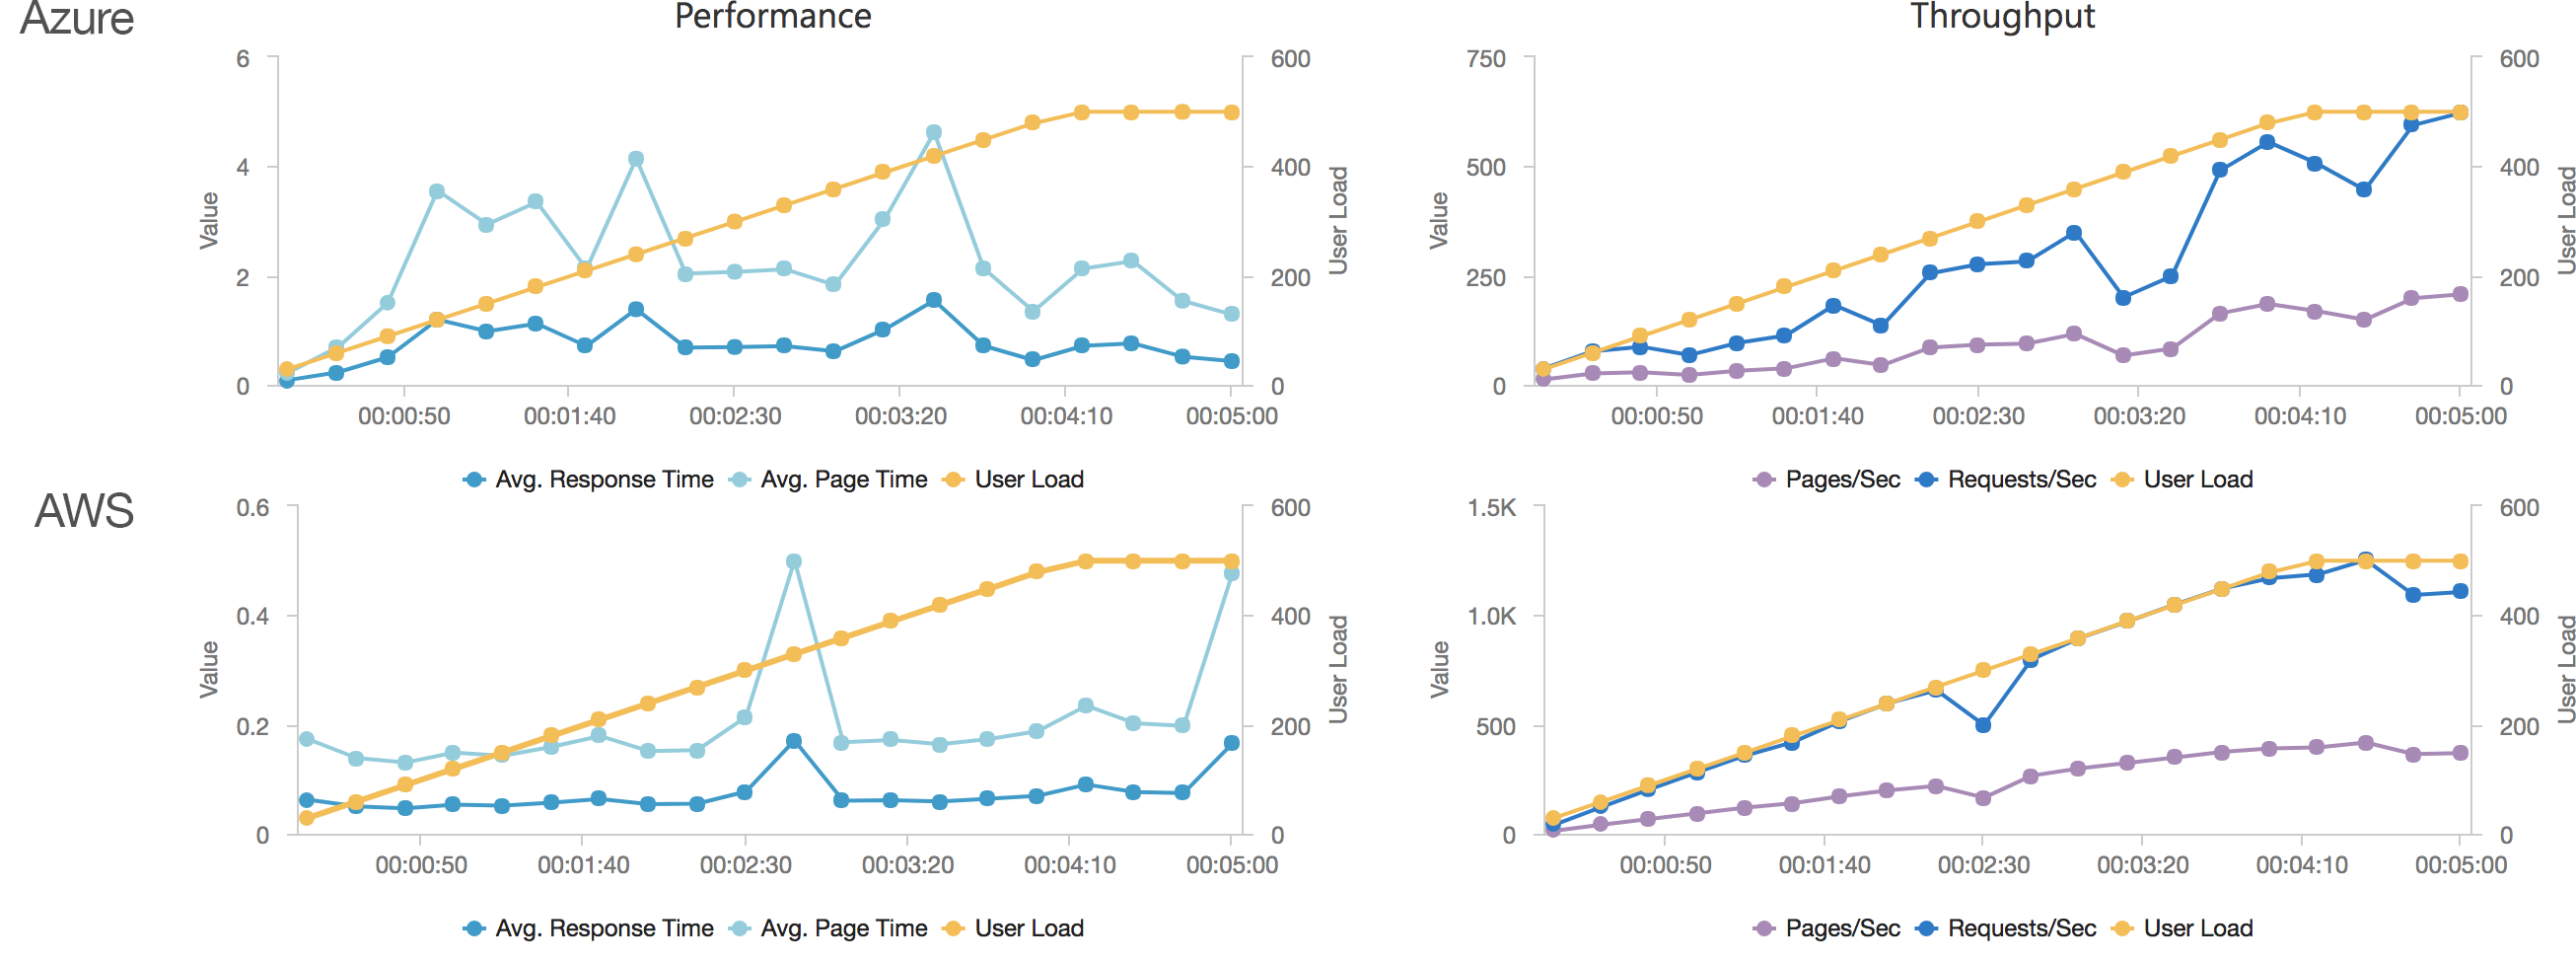
We can see from this test that AWS matches the growth in user load almost exactly, it has no issue dealing with the growing demand and page requests time hover around the 100ms mark. Contrast this with Azure which always lags a little behind the demand, is spikier, and has a much higher response time hovering around the 700ms mark.

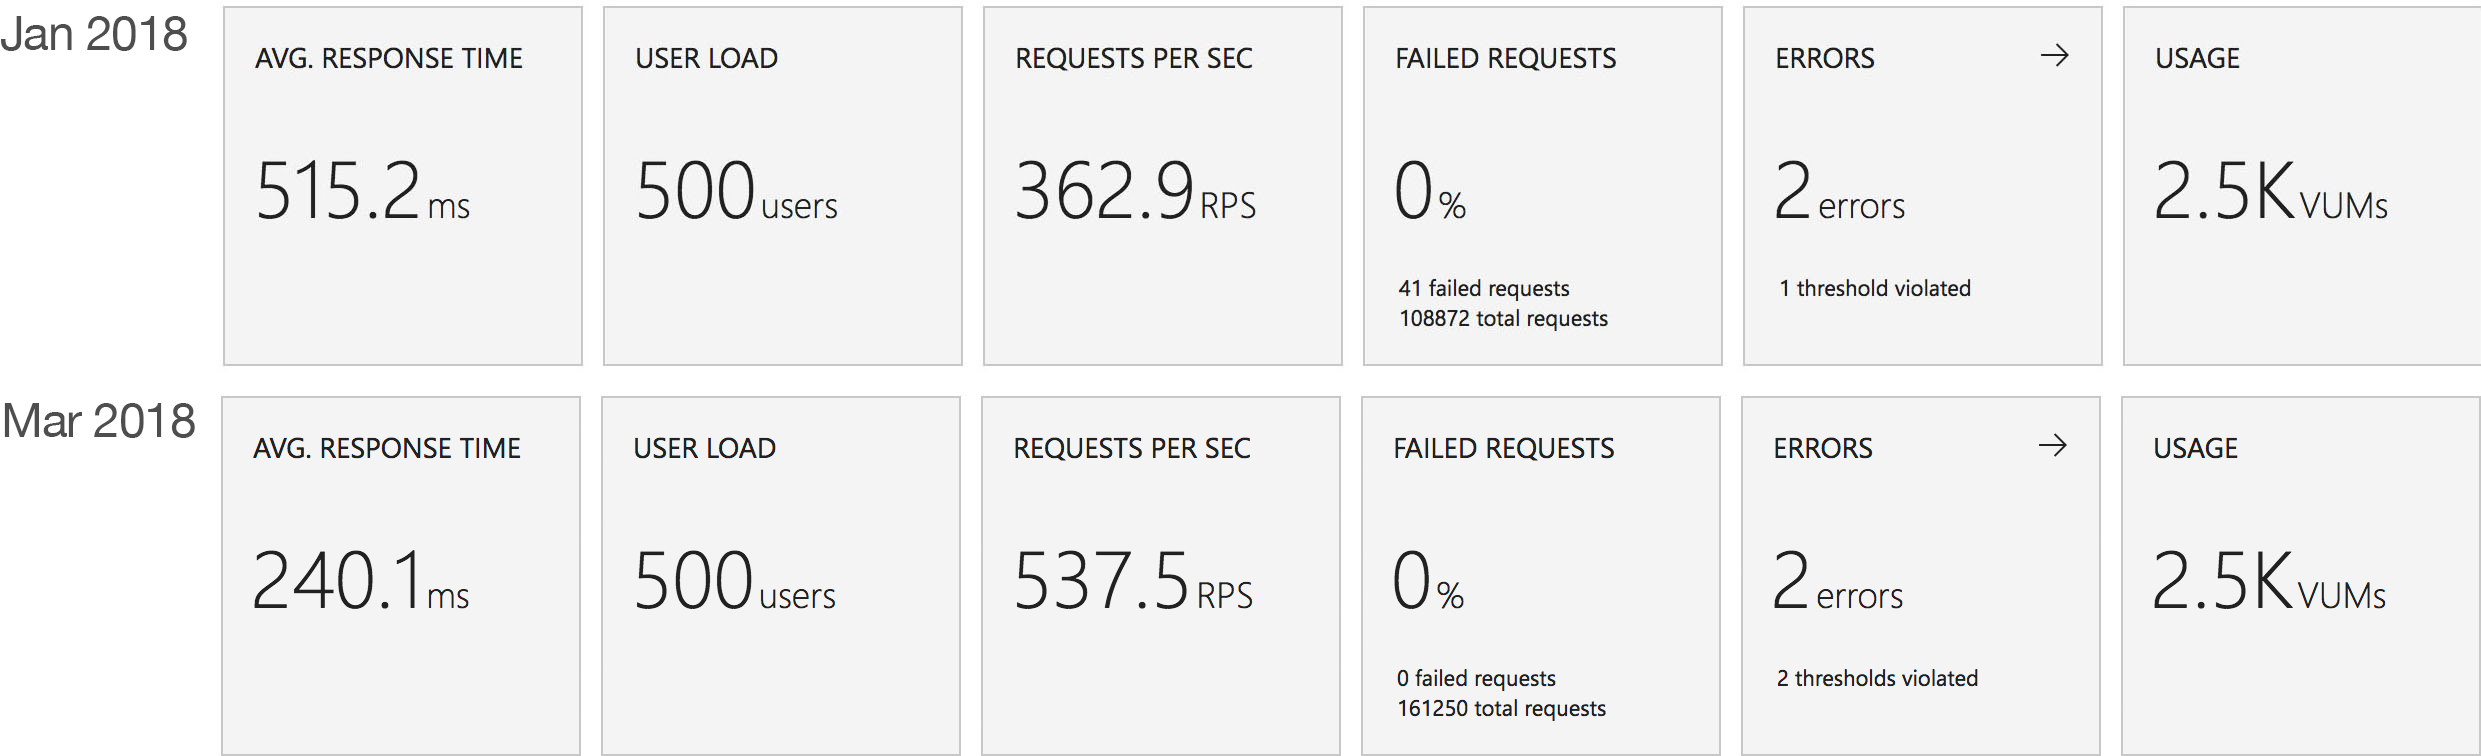
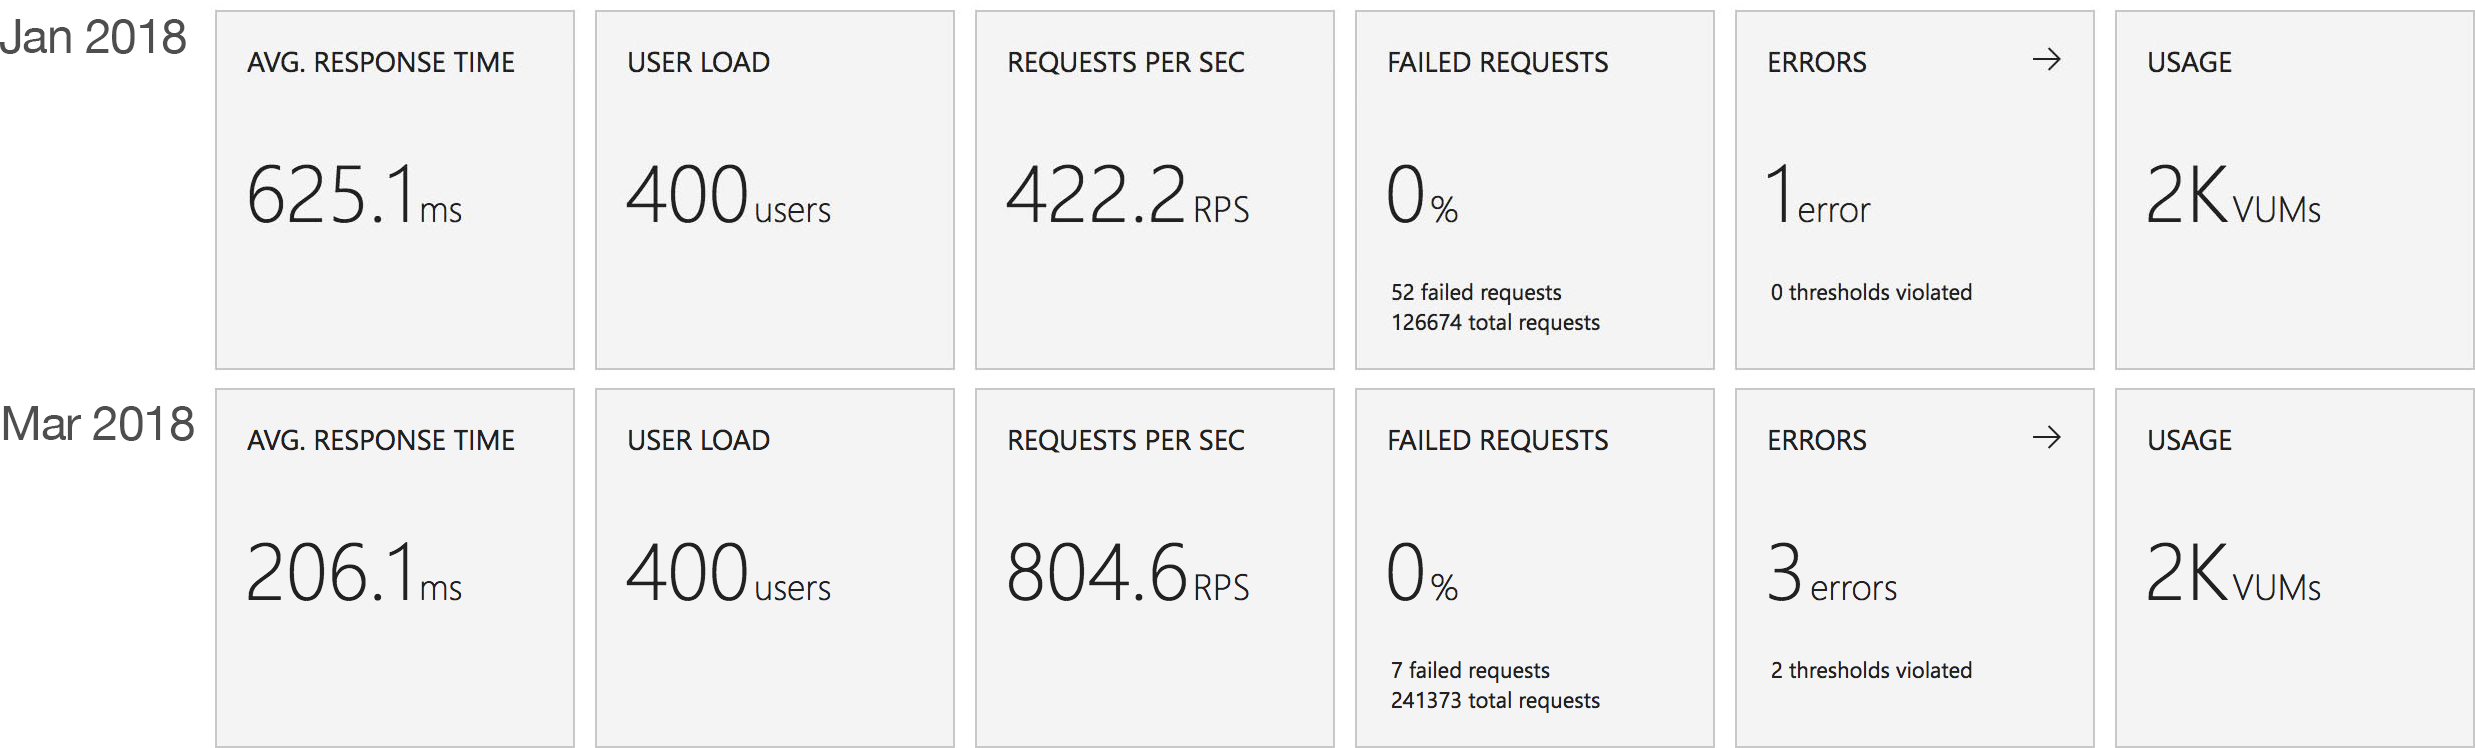
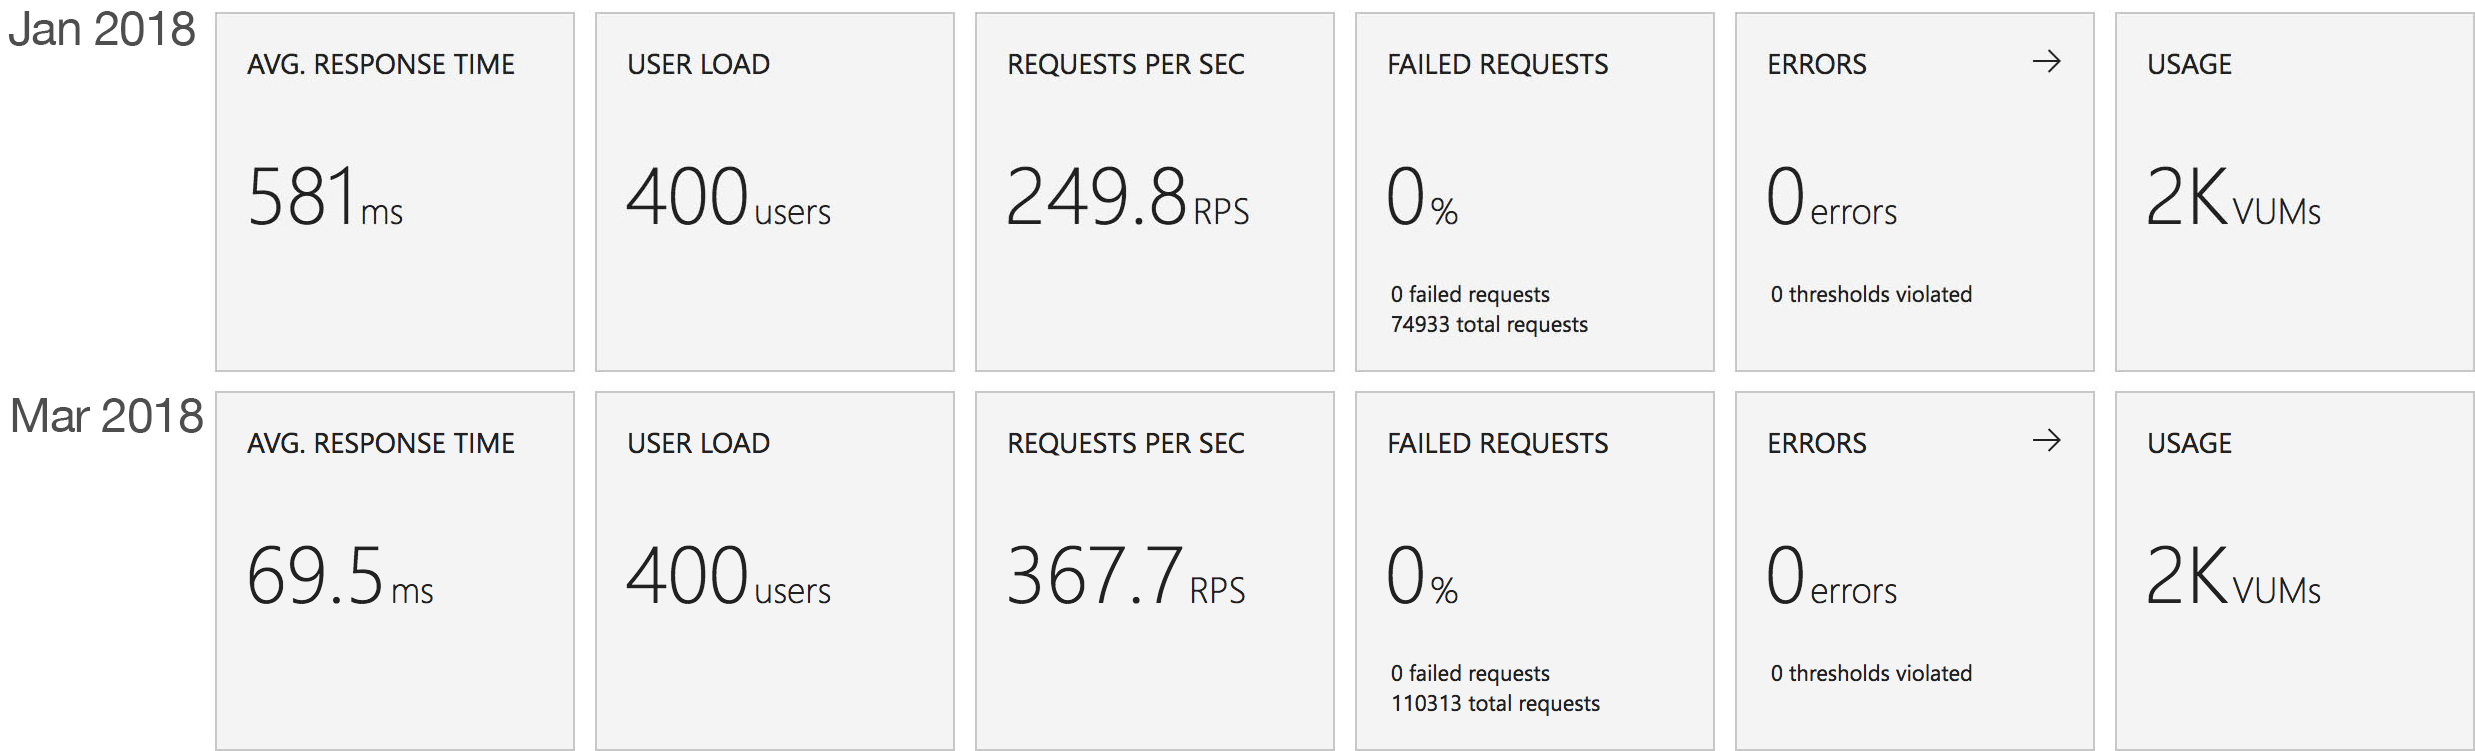
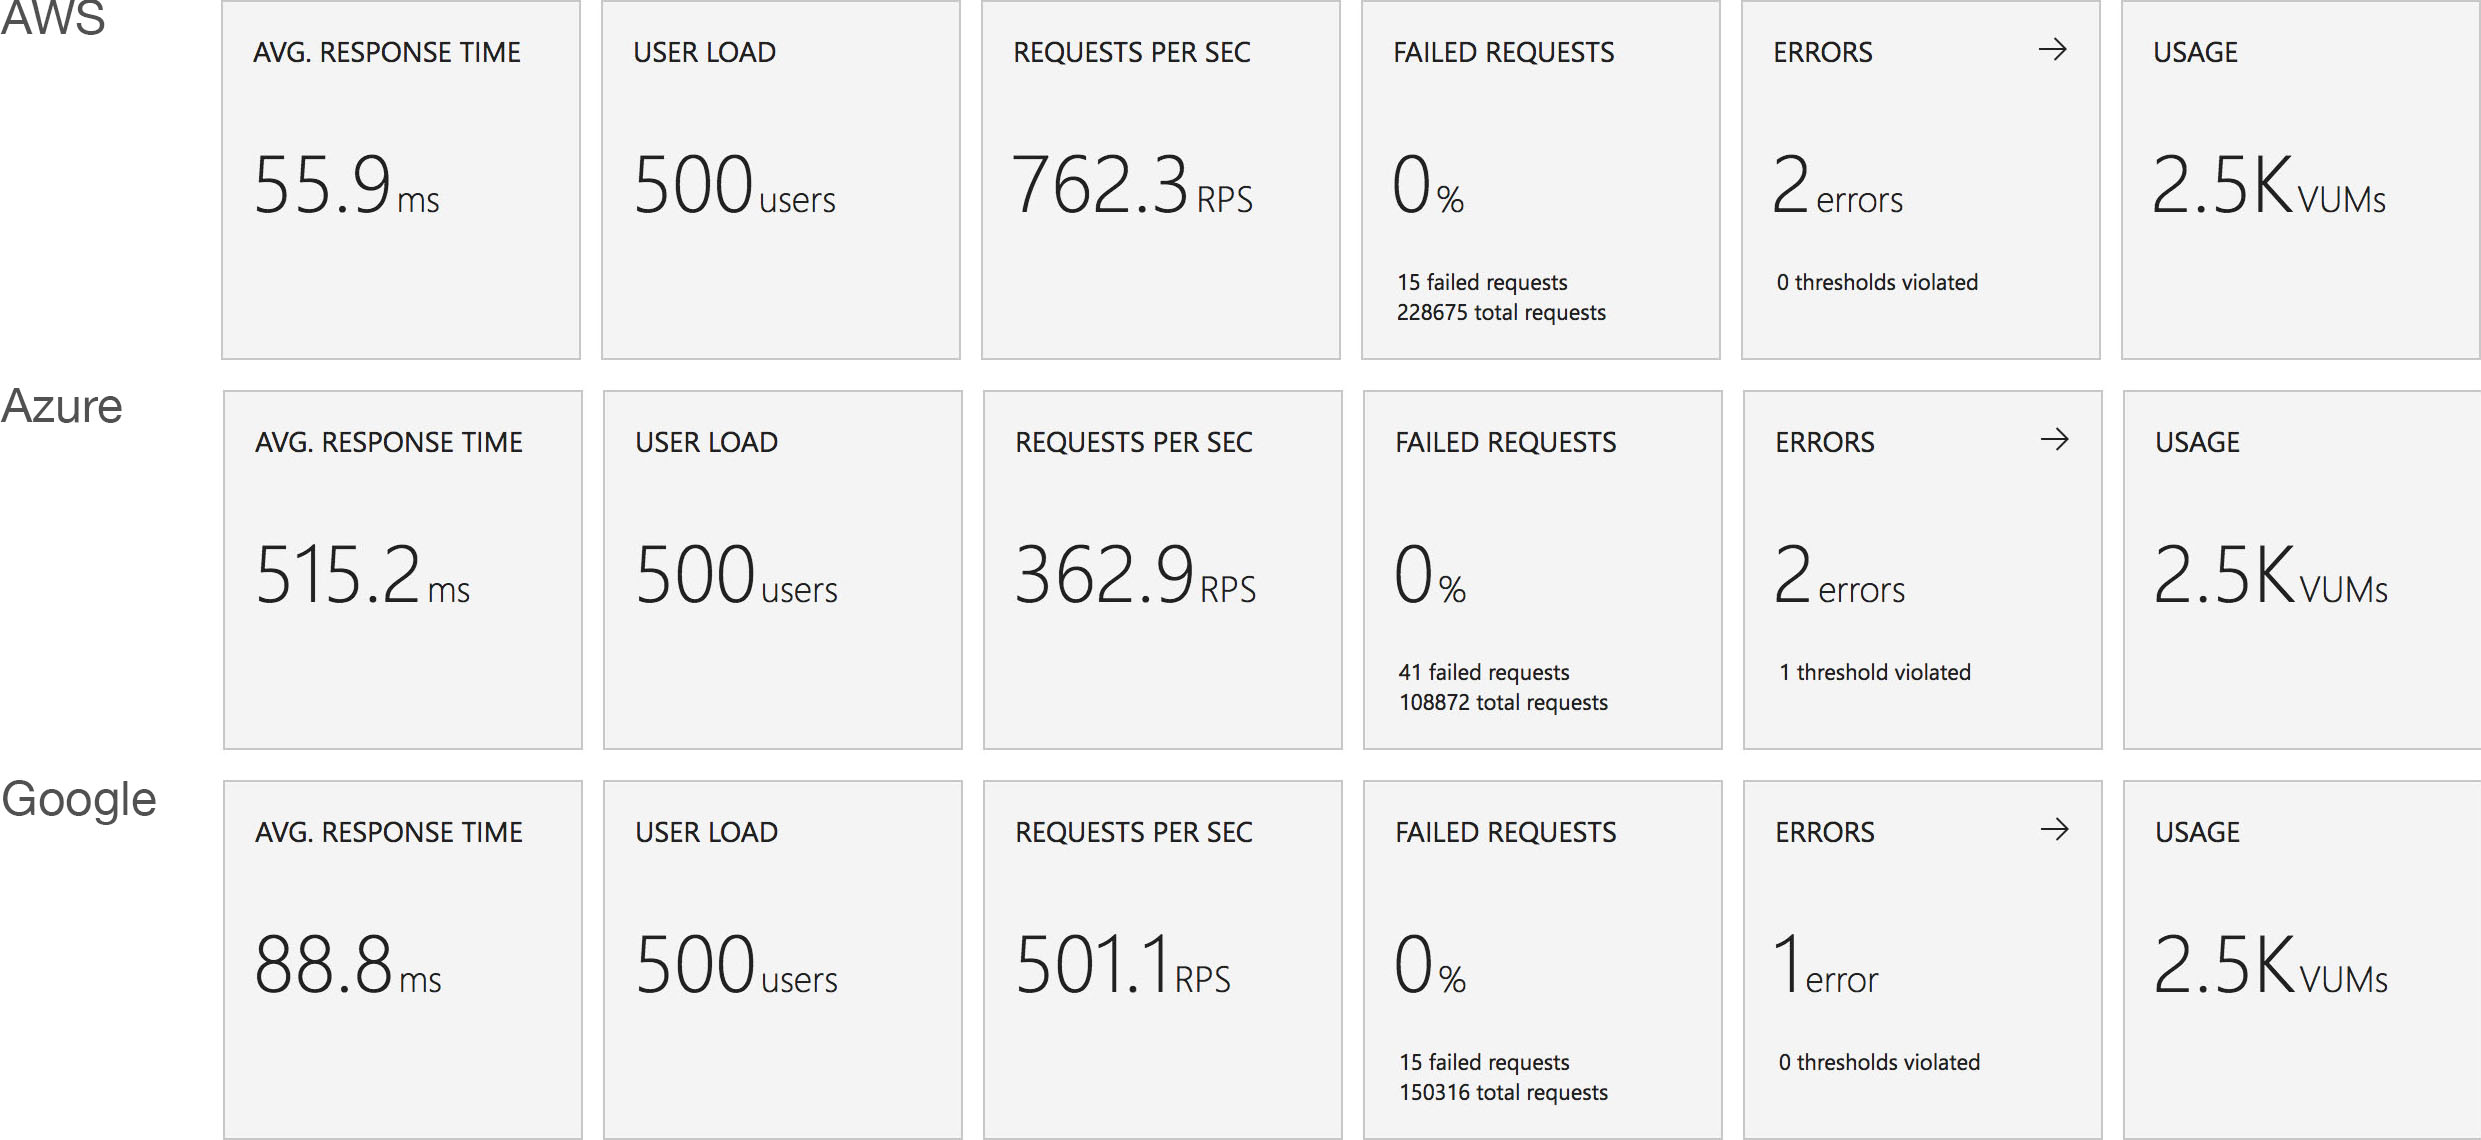
This is backed up by the average stats from the run:

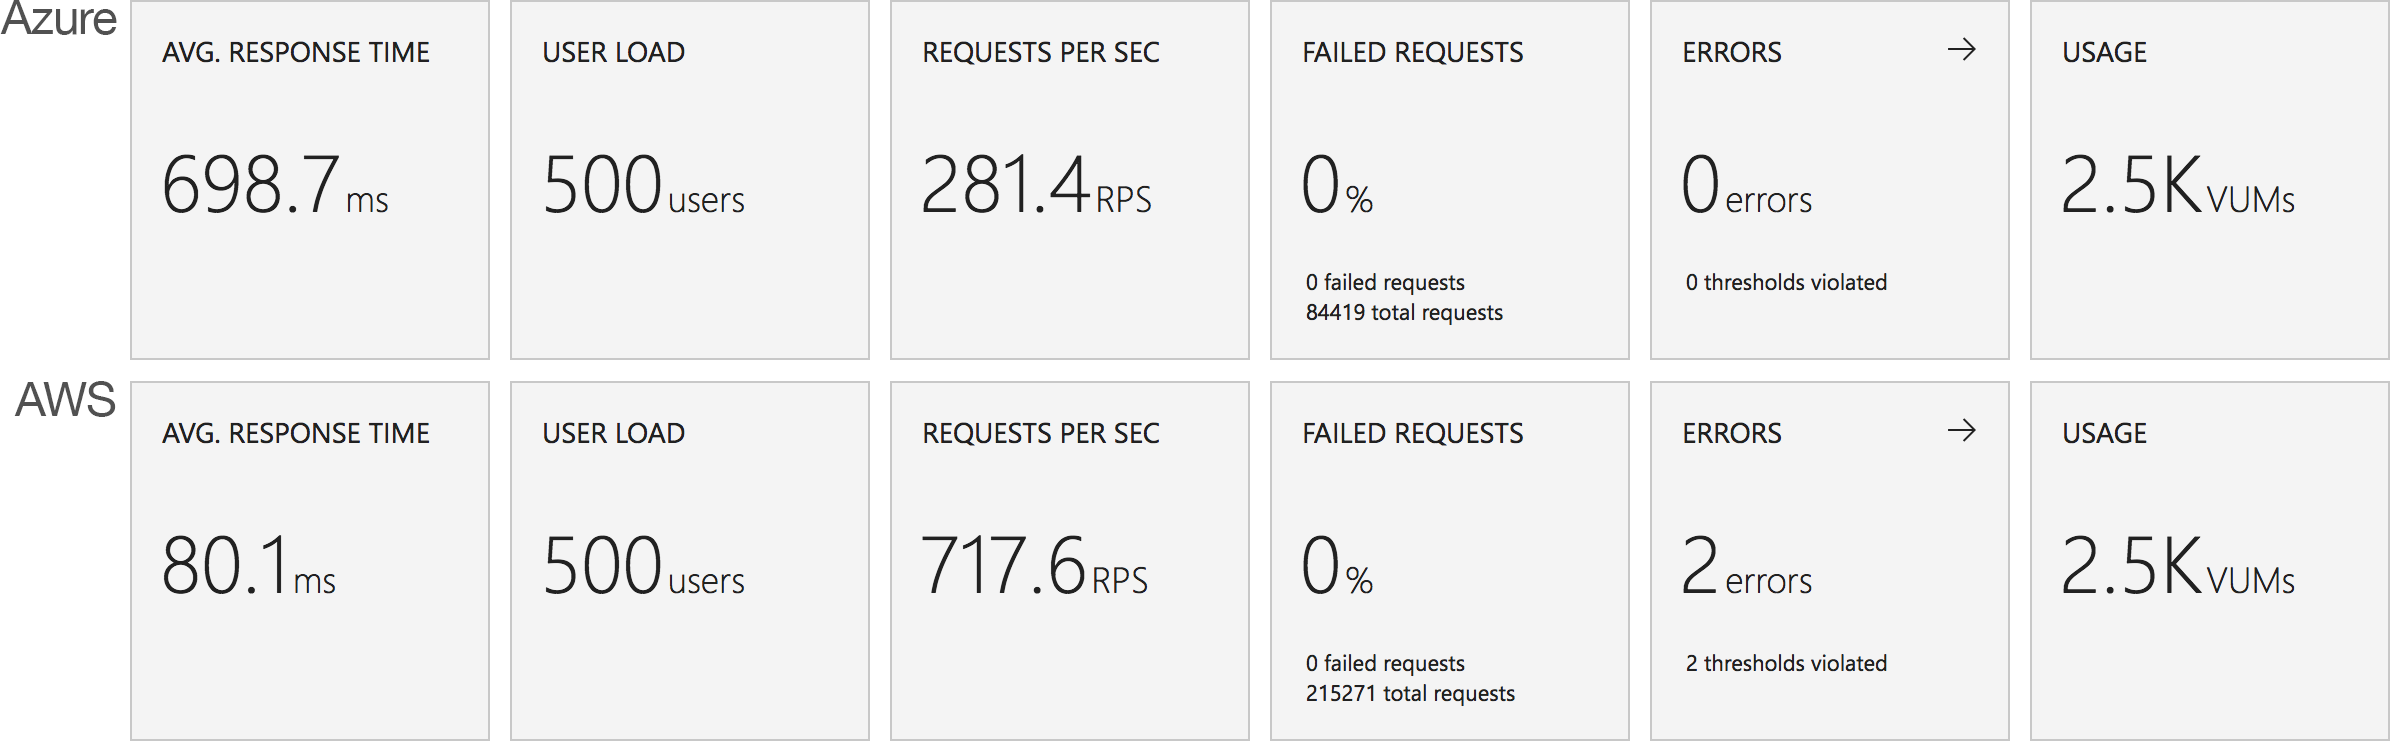
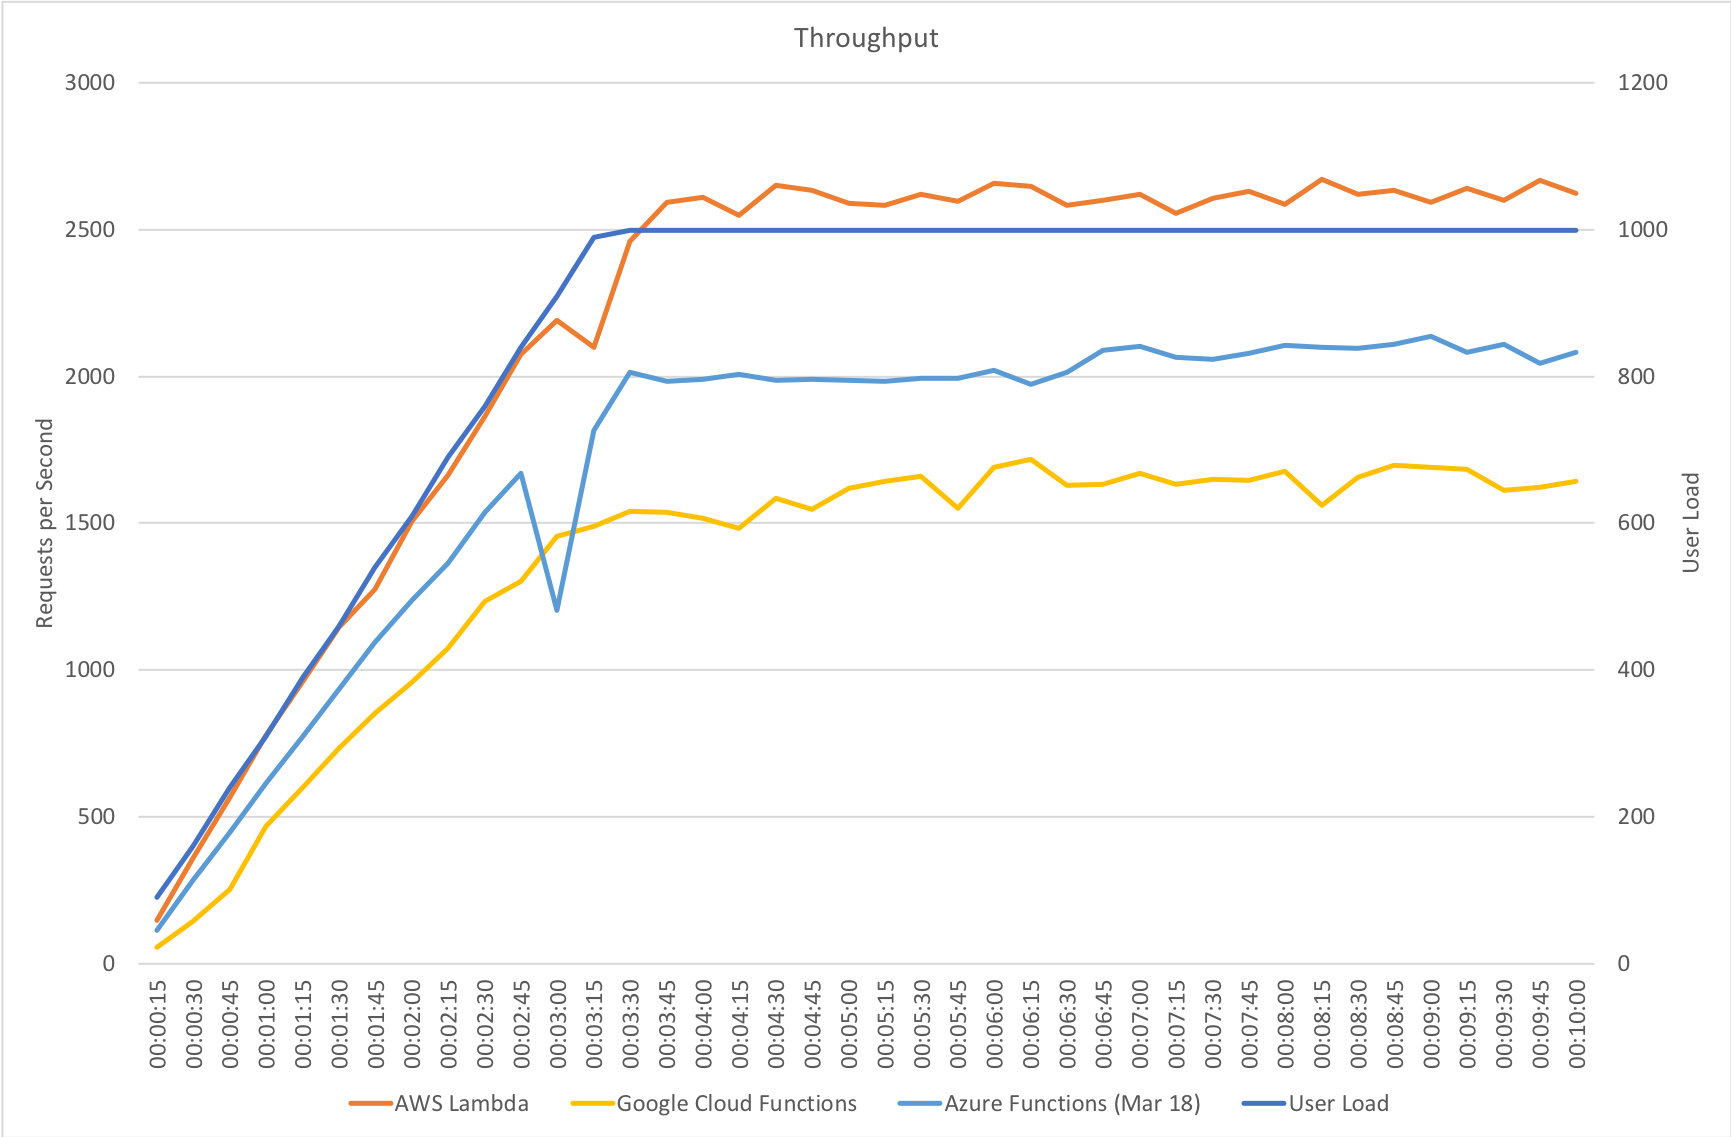
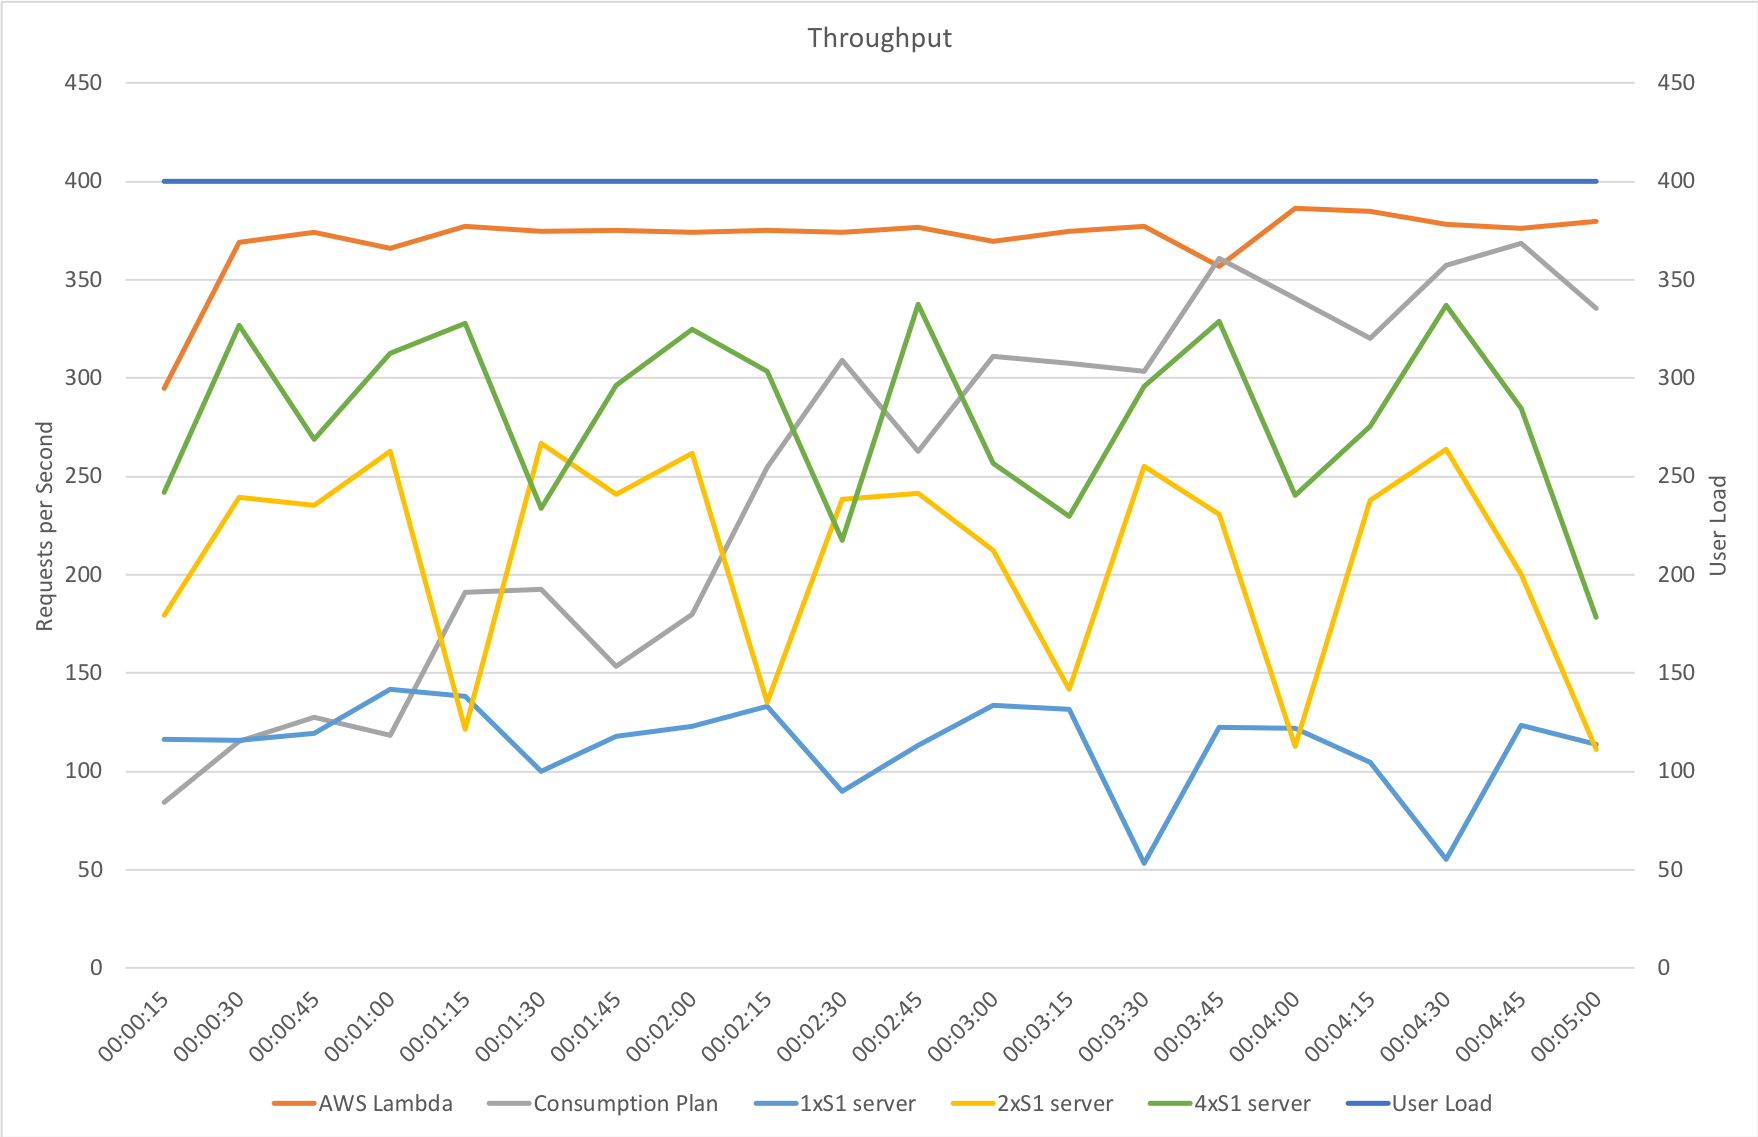
It’s interesting to note just how many more requests AWS dealt with as a result of it’s better performance: 215271 as opposed to Azure’s 84419. Well over twice as many.

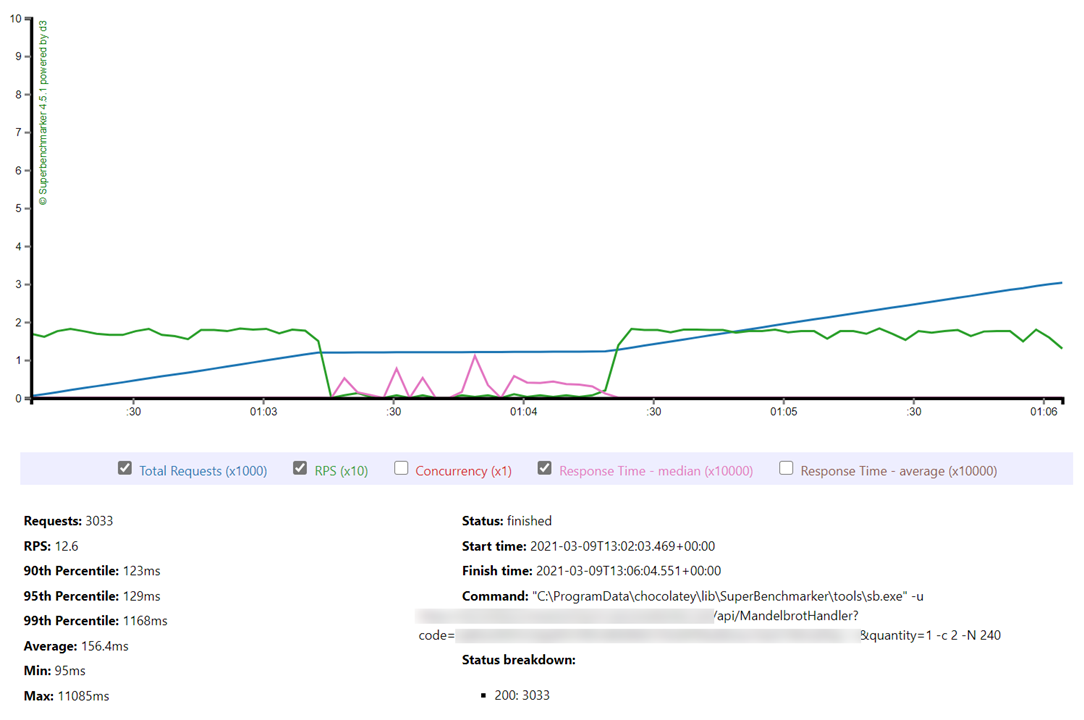
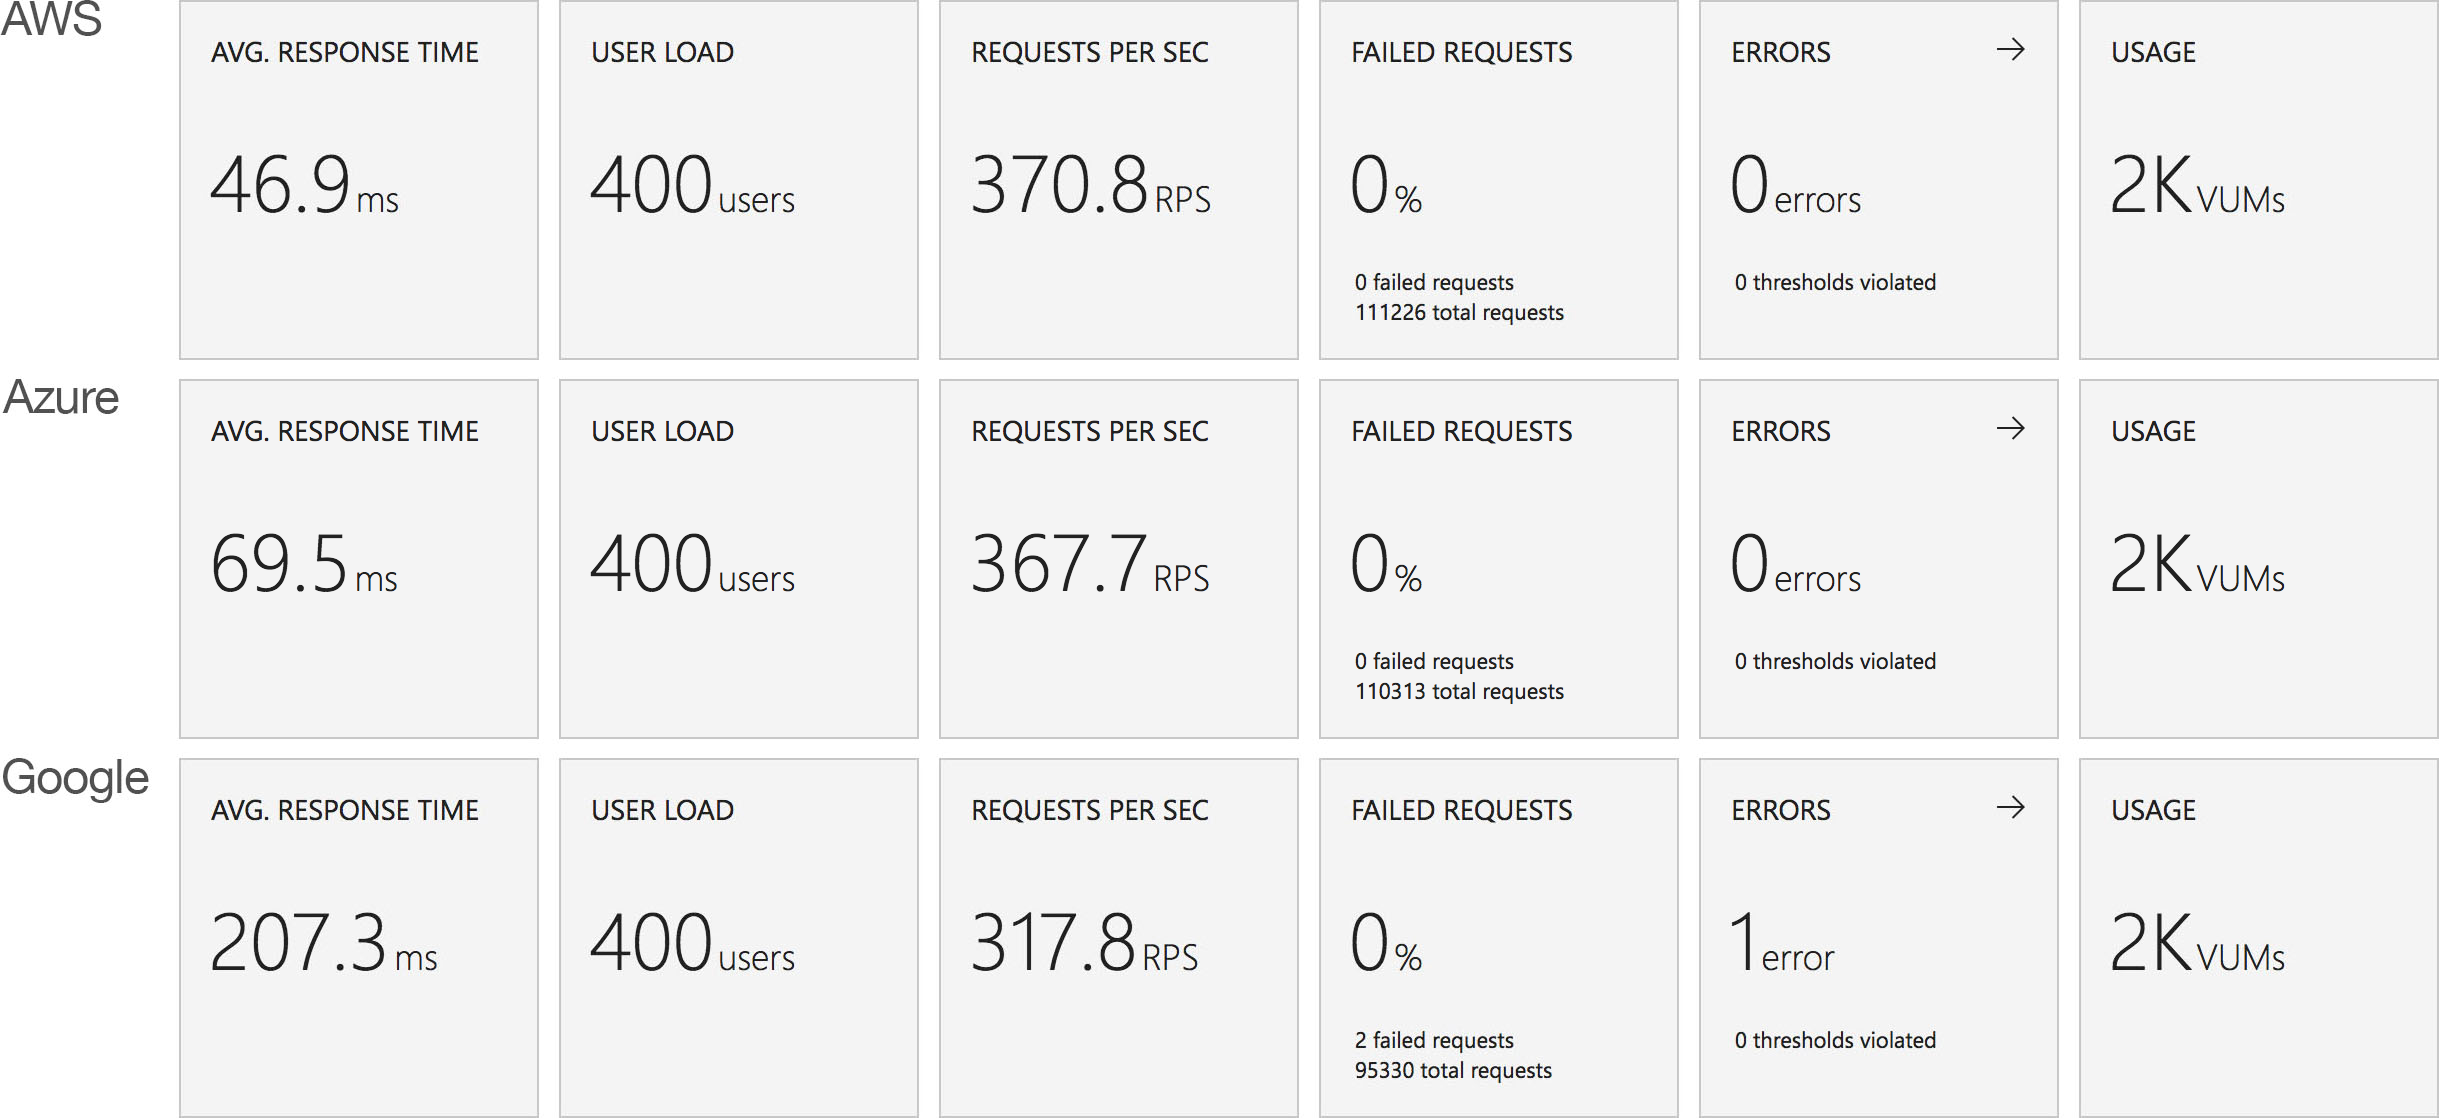
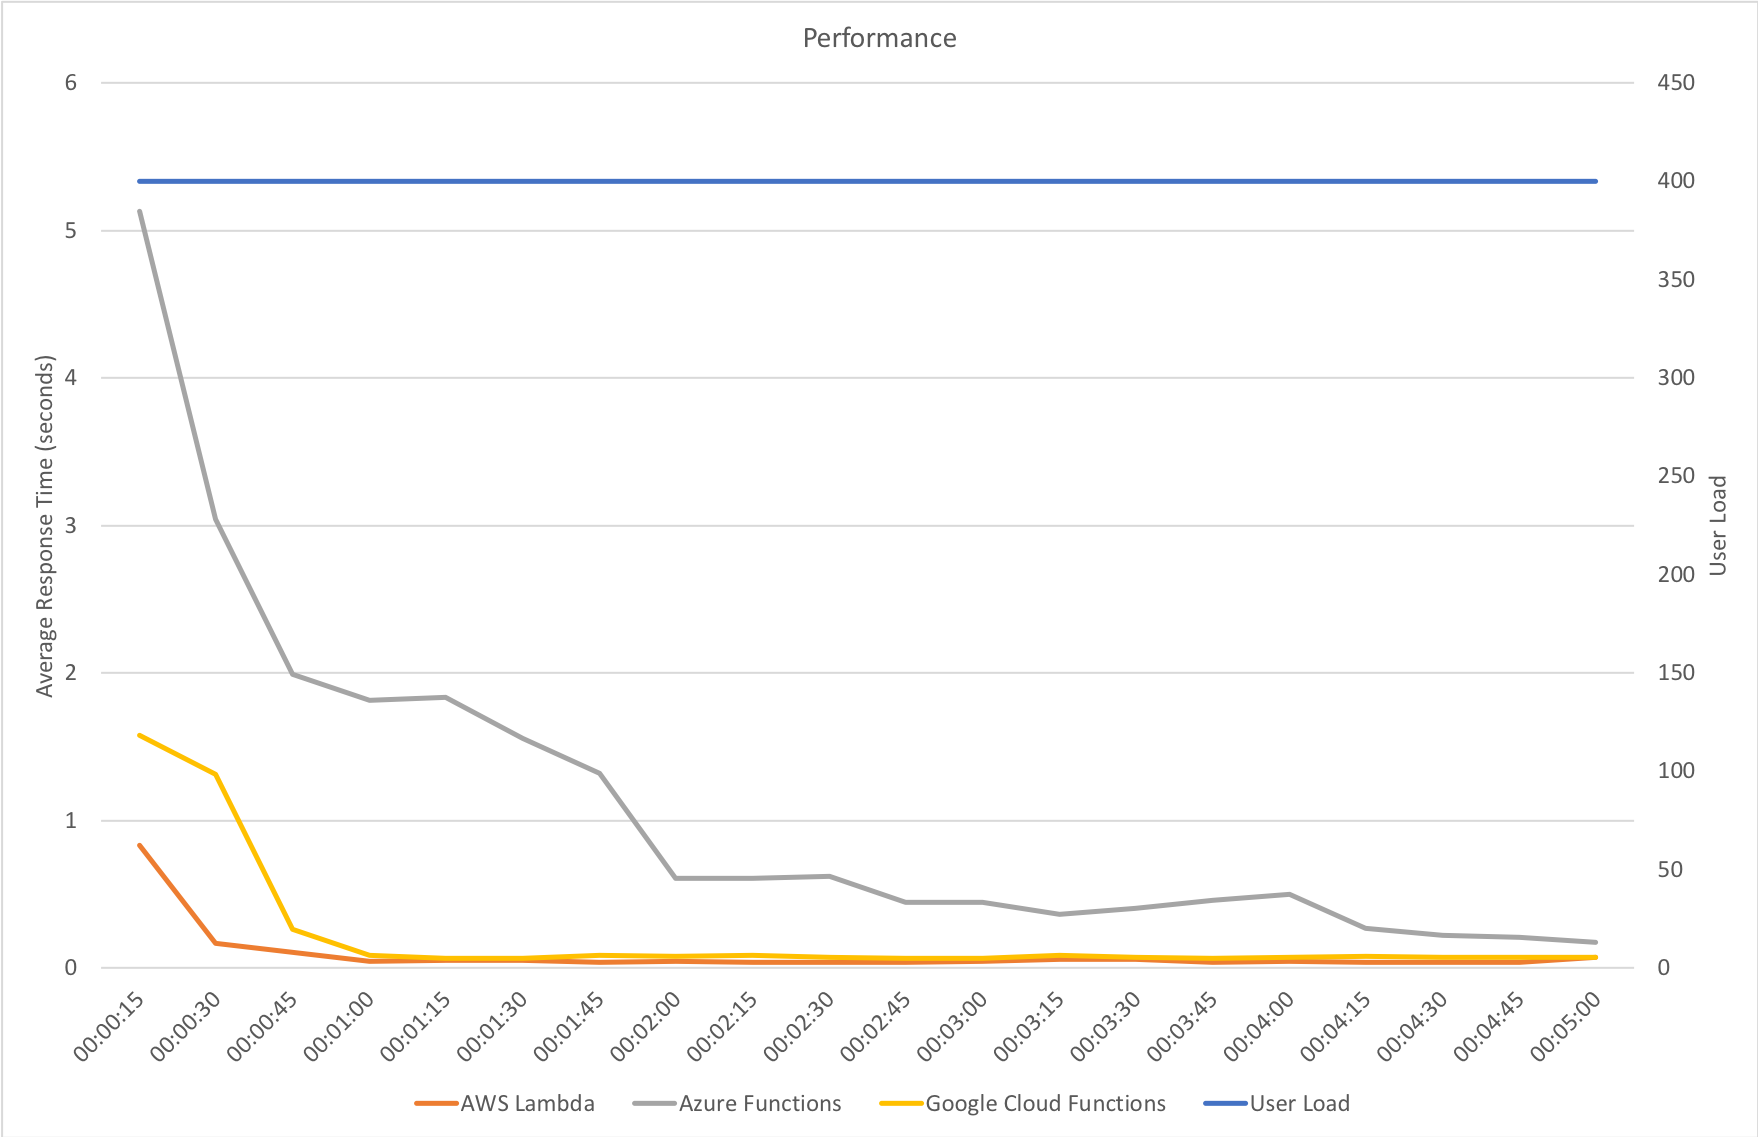
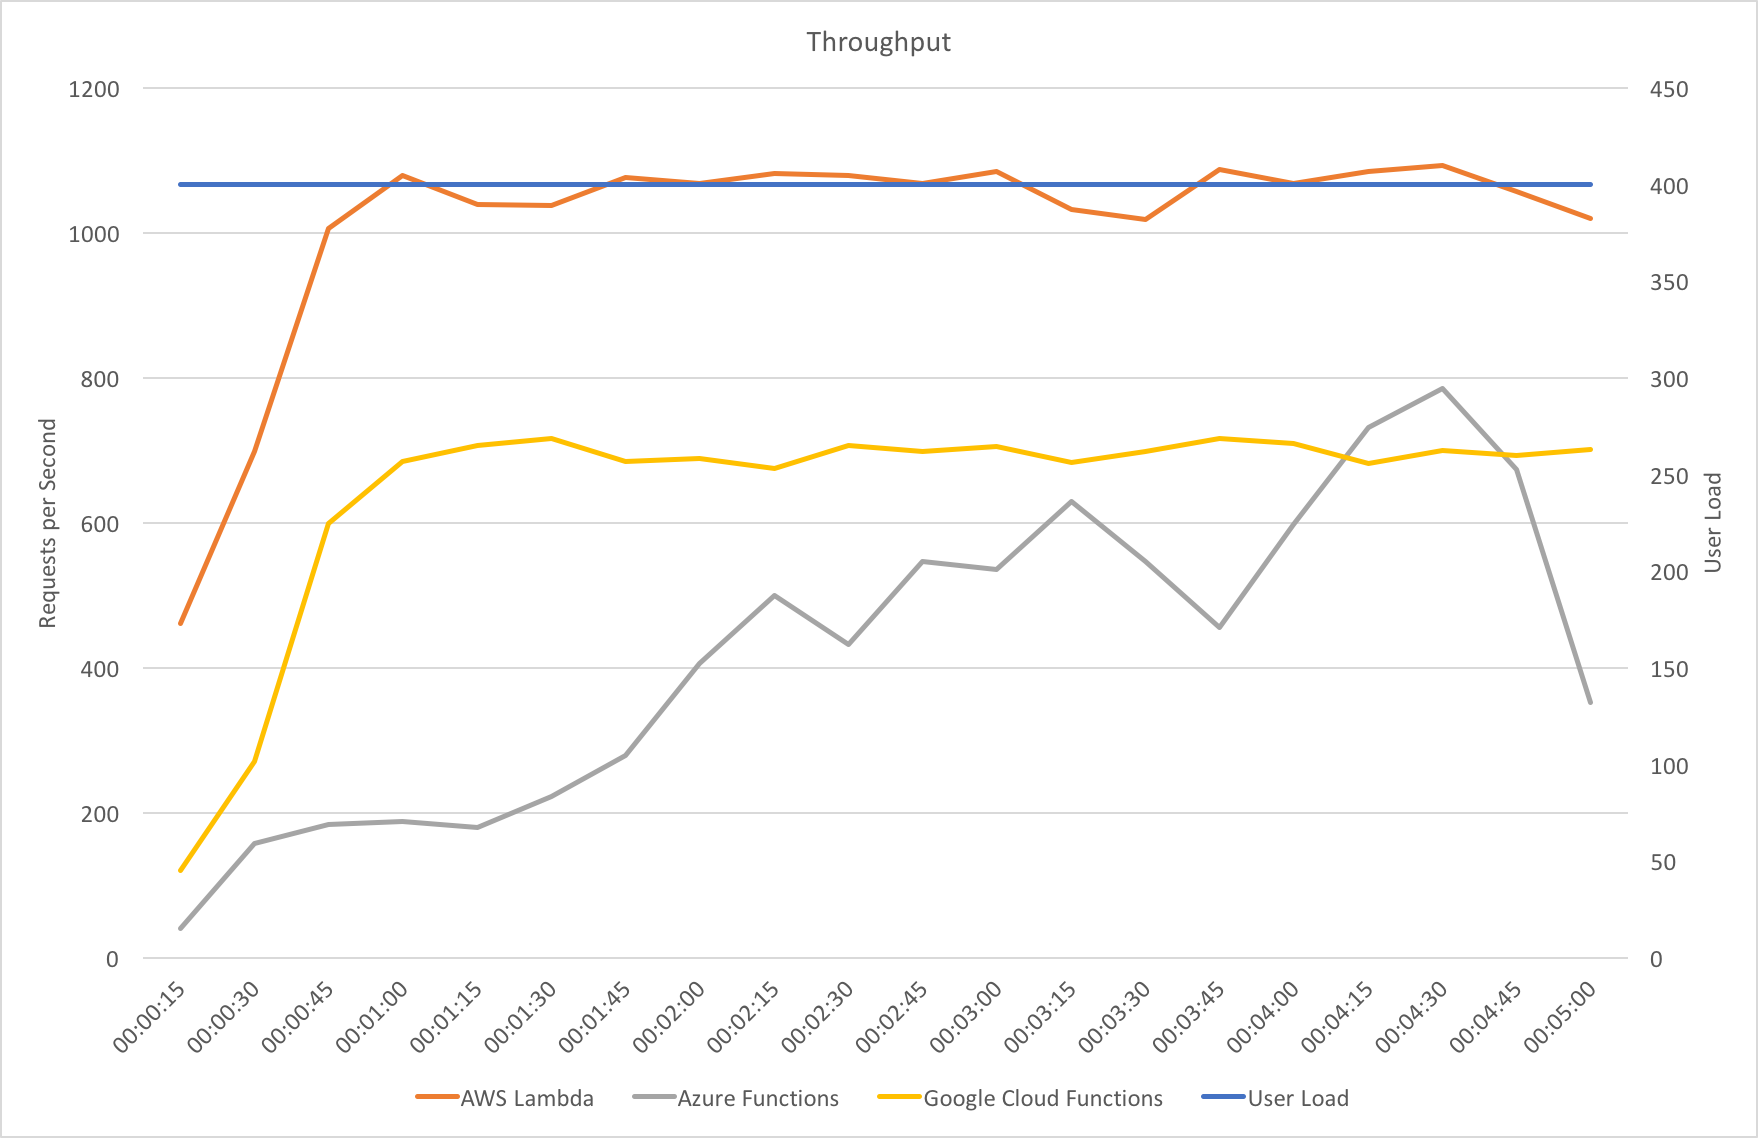
Constant Load of 400 Concurrent Users

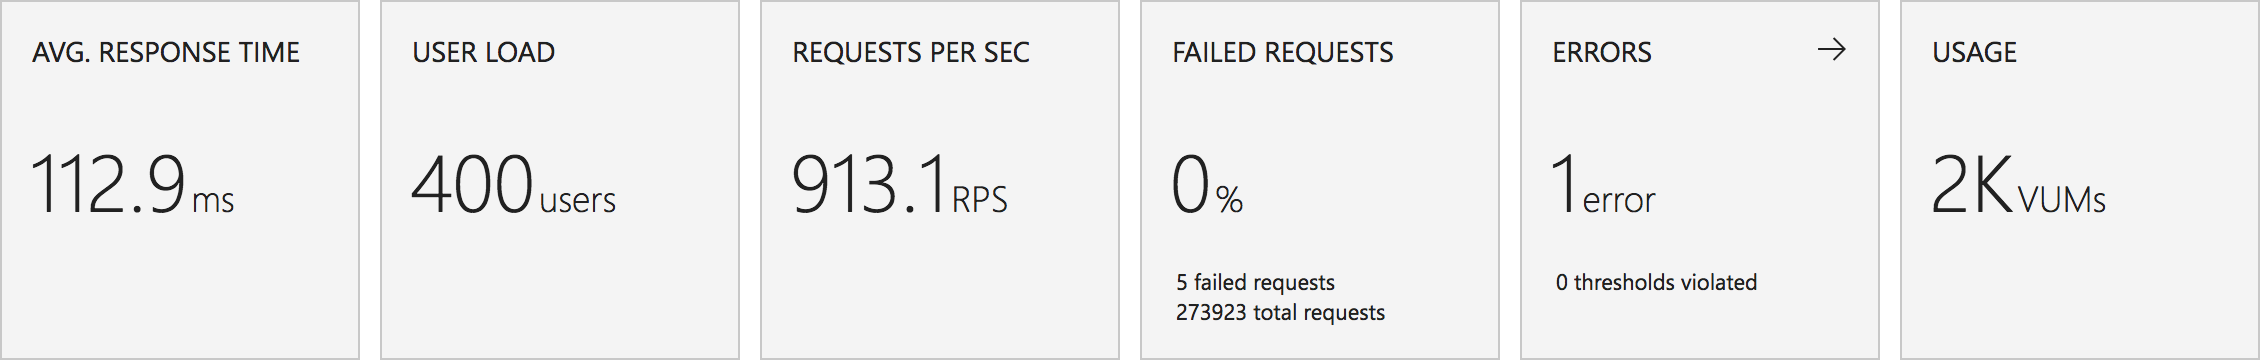
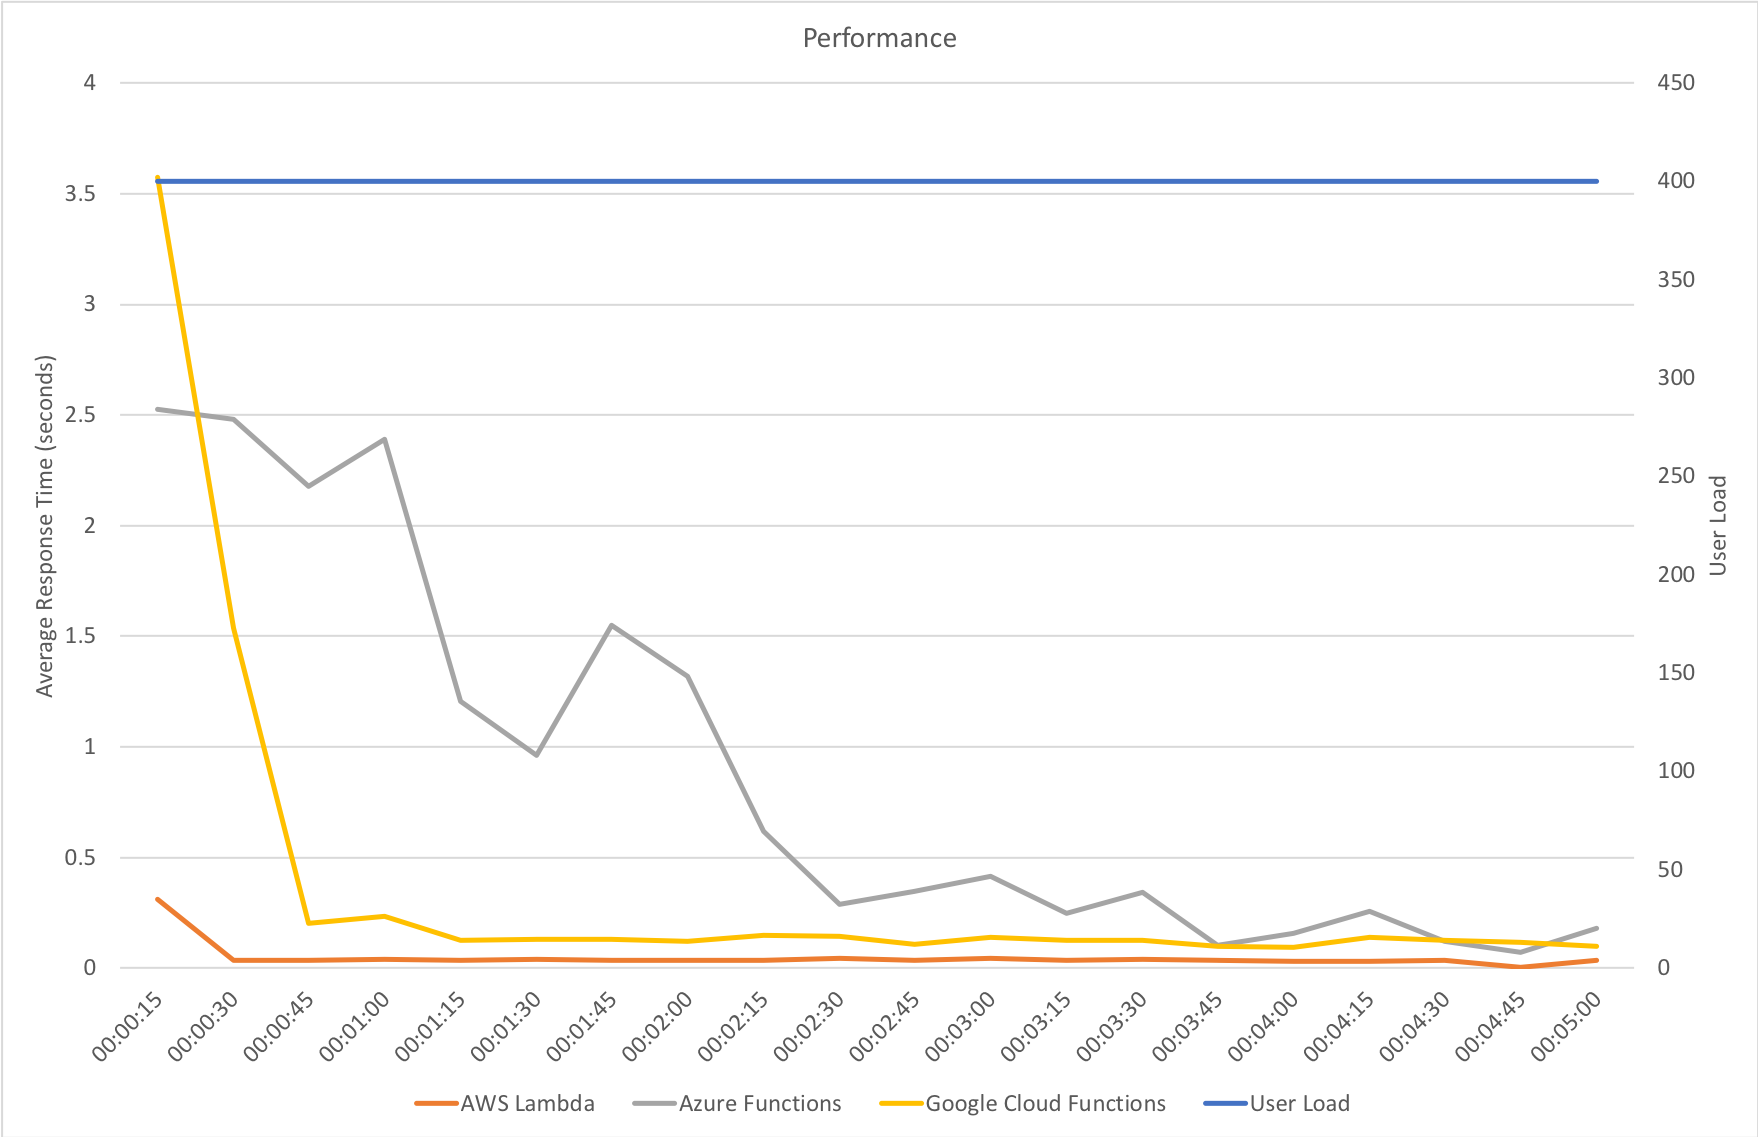
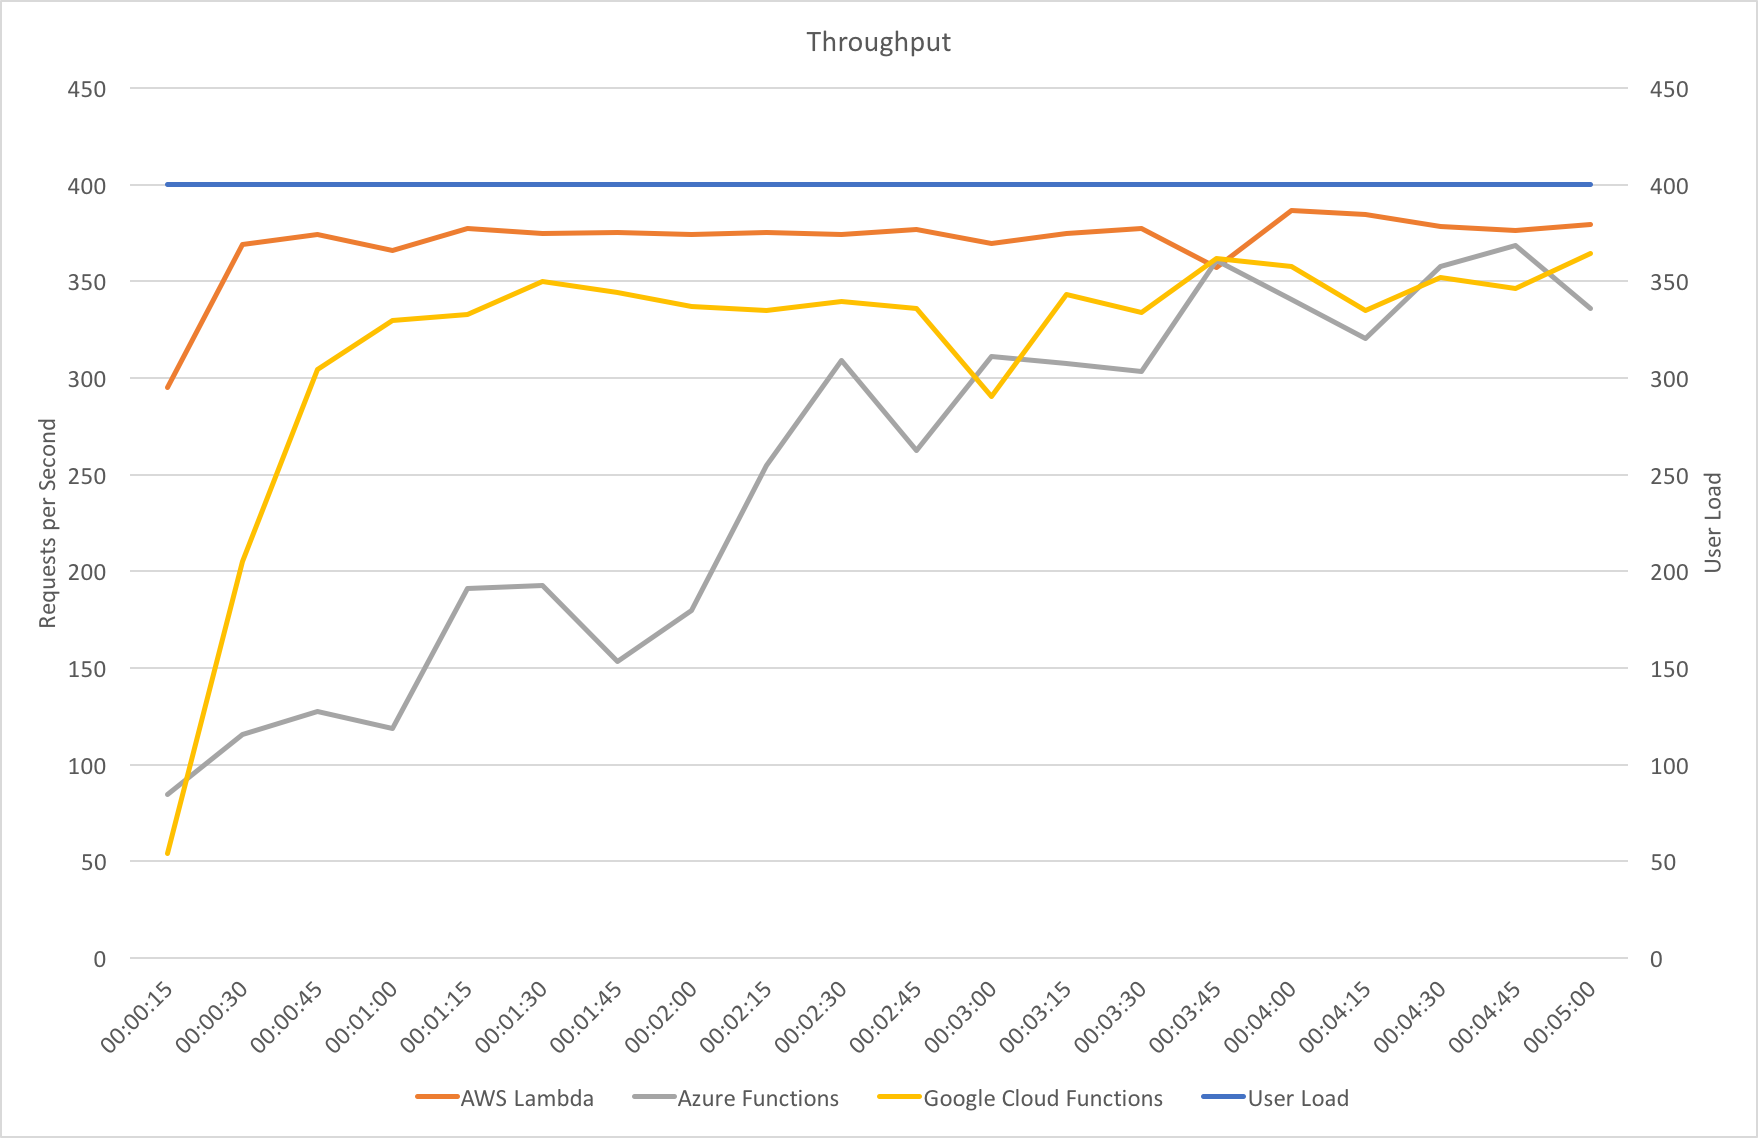
This test hits the application with 400 concurrent users from a standing start and runs over a 10 minute period simulating a sudden spike or influx of traffic and looking at how quickly each serverless environment is able to deal with the load. Neither environment was completely cold as I’d been refreshing the view in the browser but neither had had any significant traffic for some time. The contrast is significant to say the least:

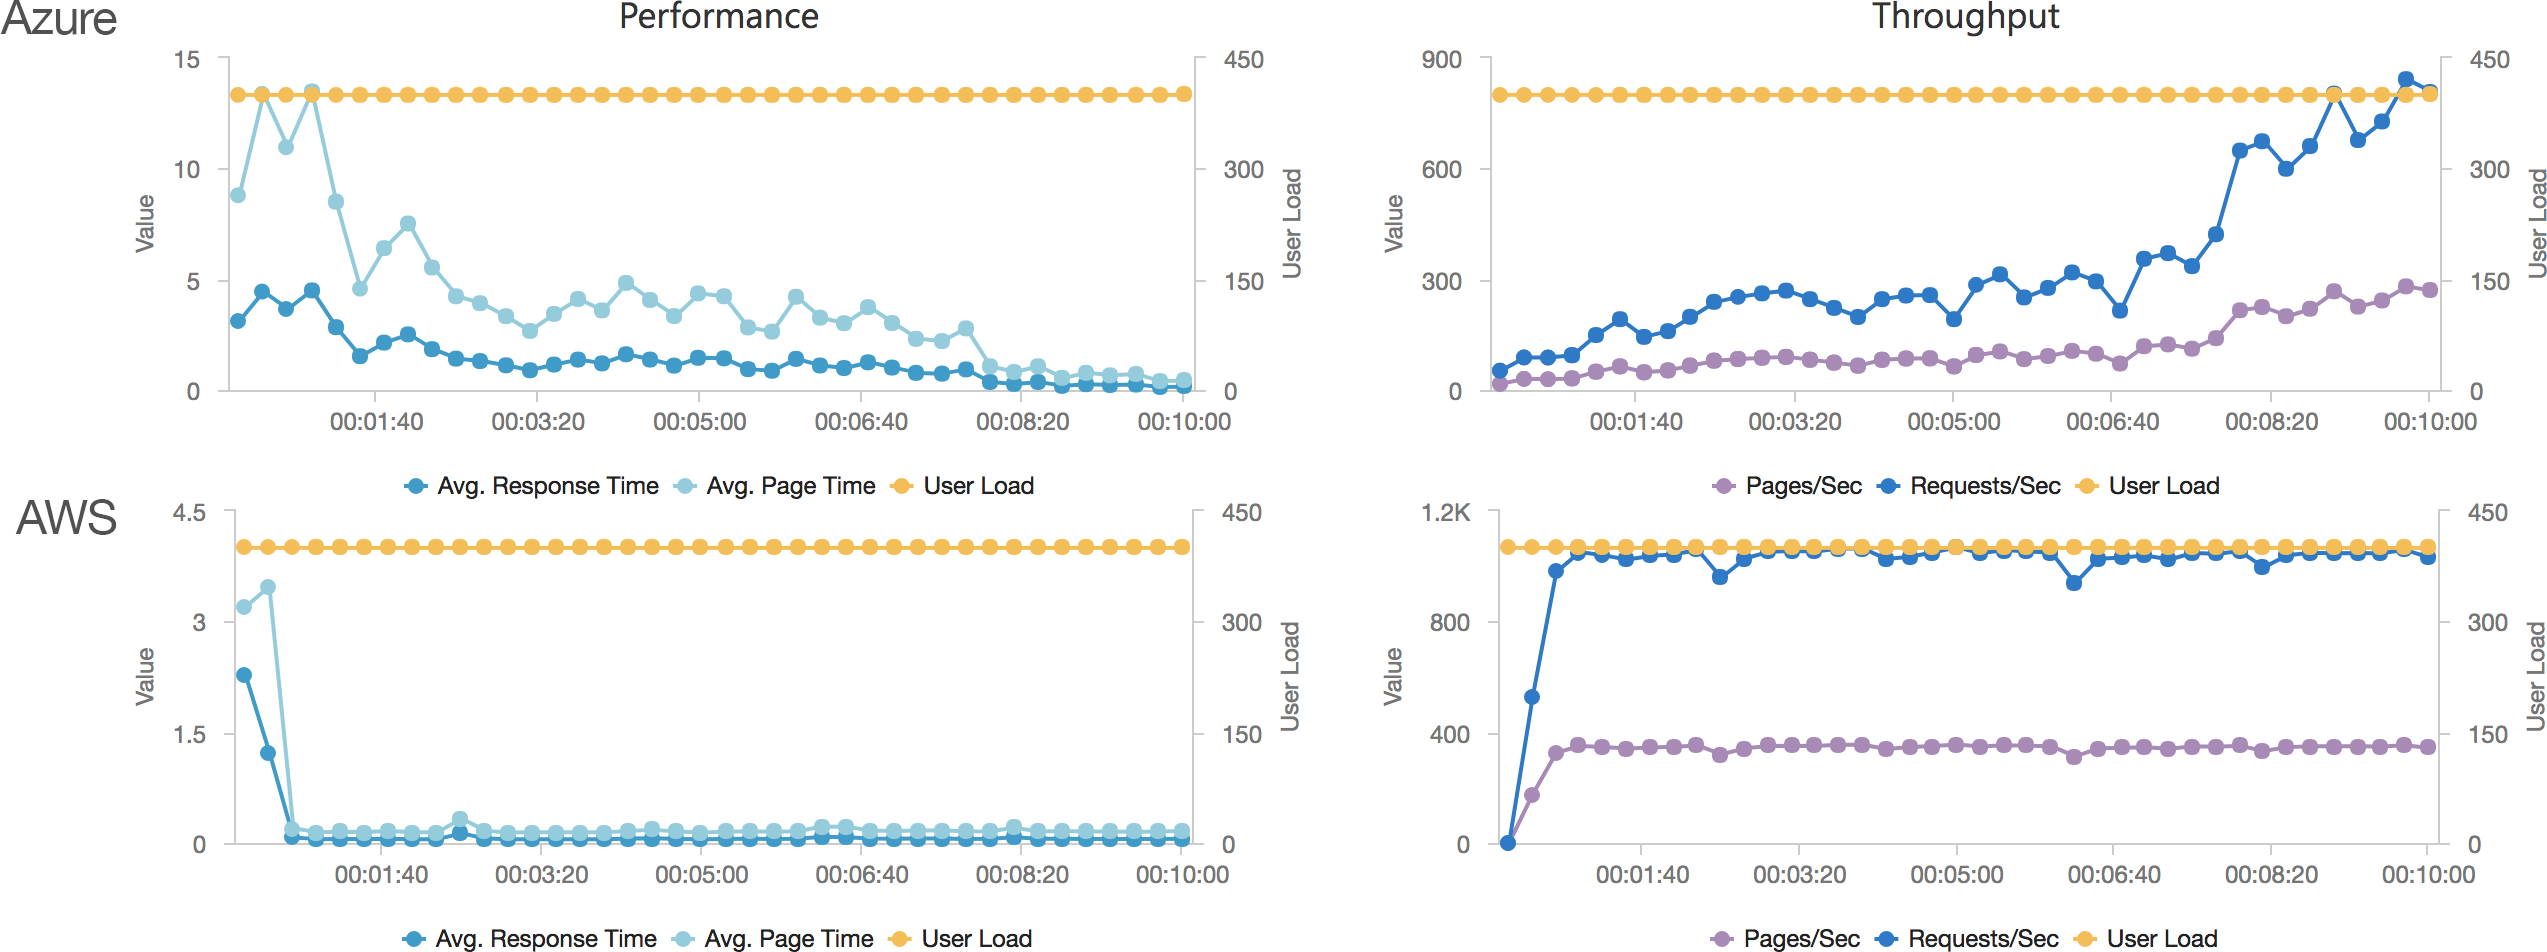
Let’s cover AWS first as it’s so simple: it quickly absorbs the load and hits a steady response time of around 80ms again in under a minute.

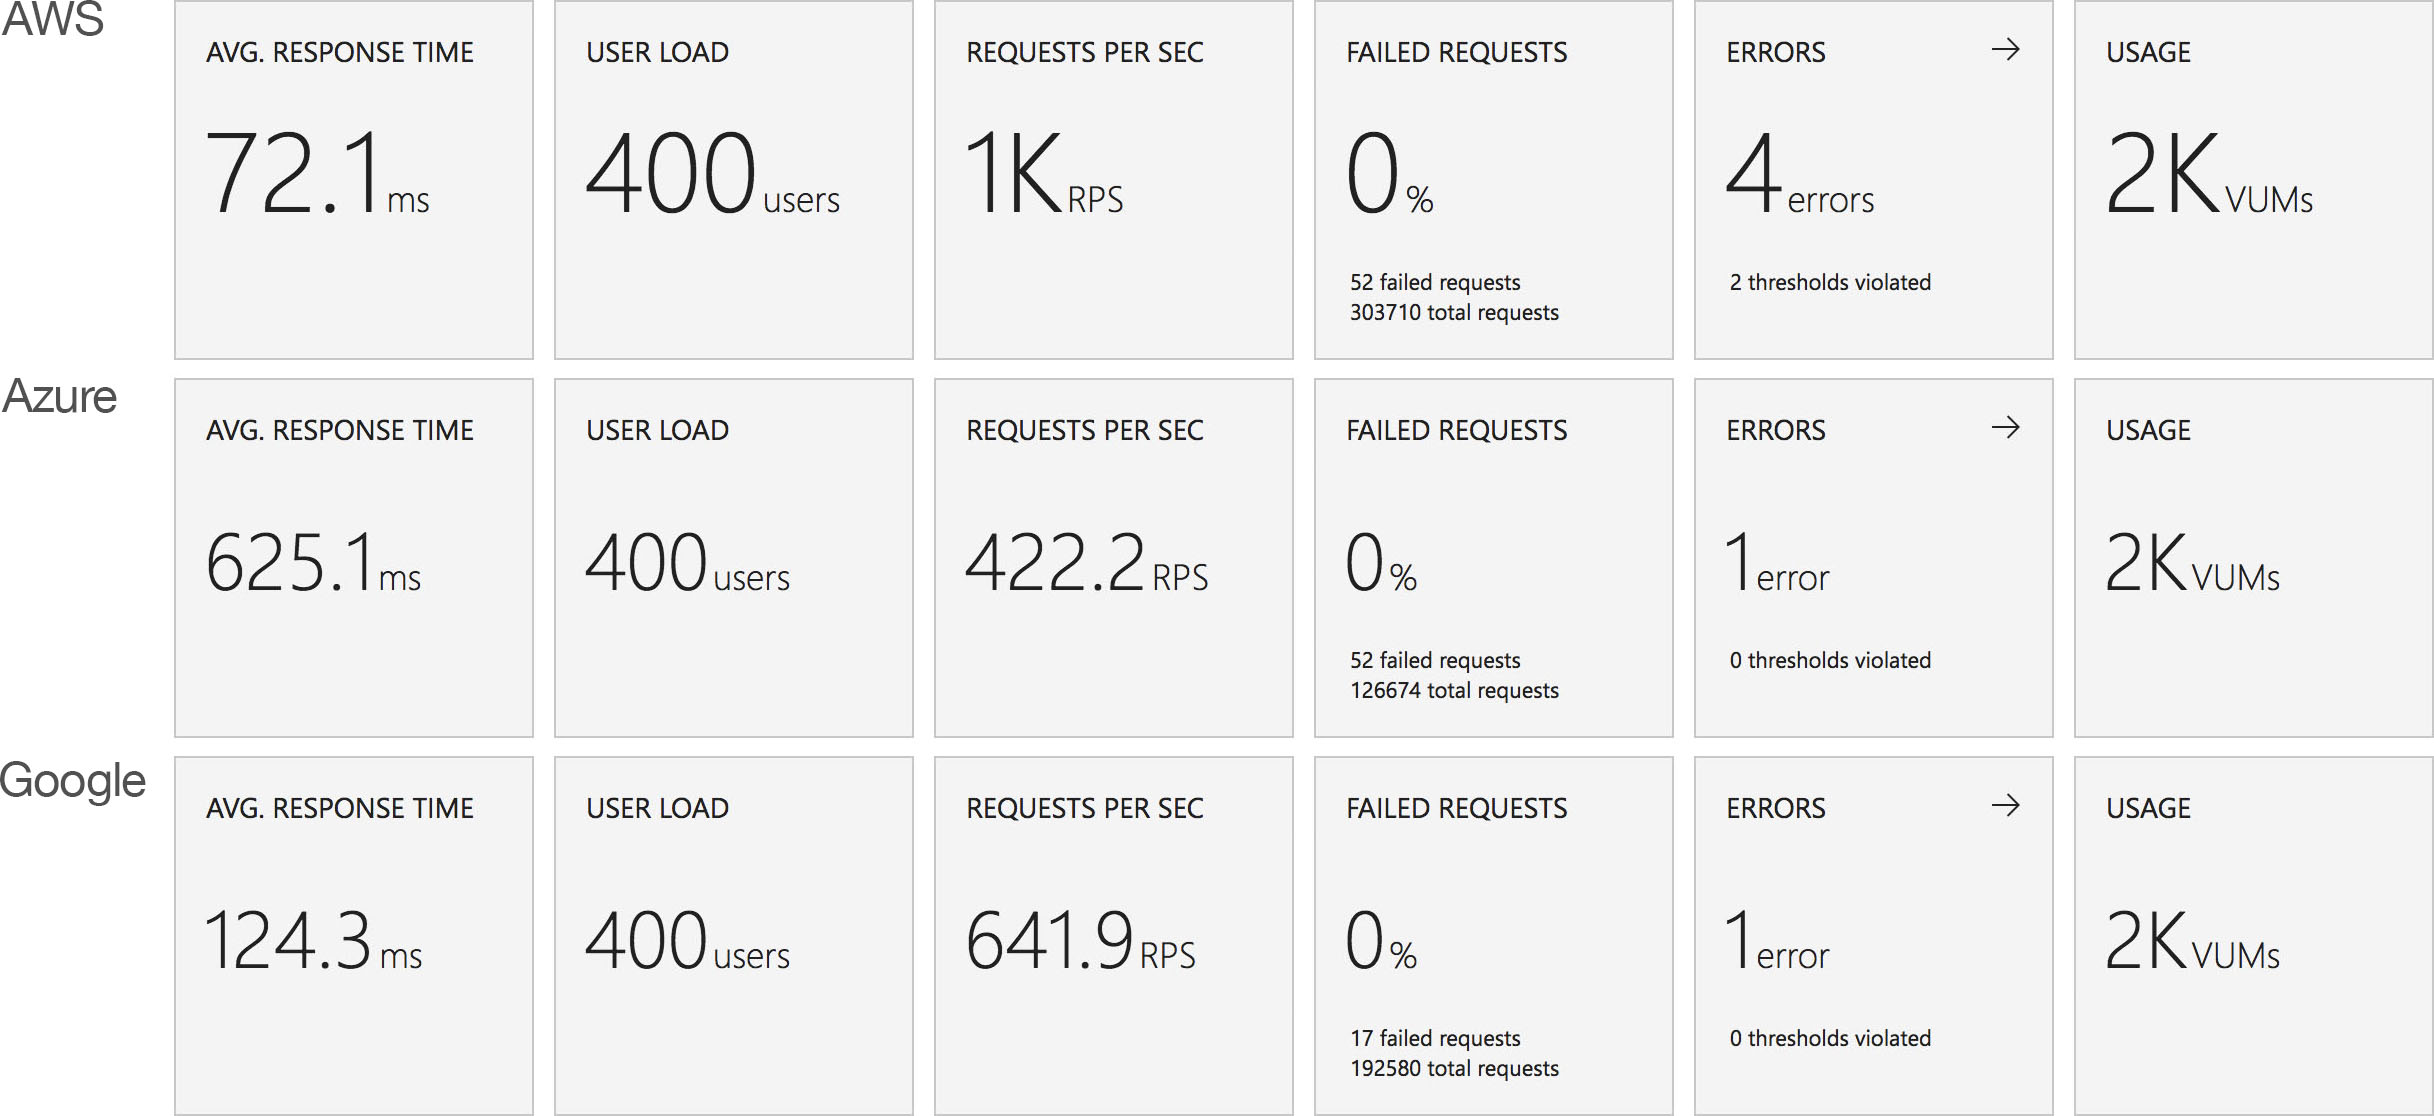
Azure, on the other hand, is more complex. Average response time doesn’t fall under a second until the test has been running for 7 minutes and it’s only around then that the system is able to get near the throughput AWS put out in a minute. Pretty disappointing and backed up by the overall stats for the run:

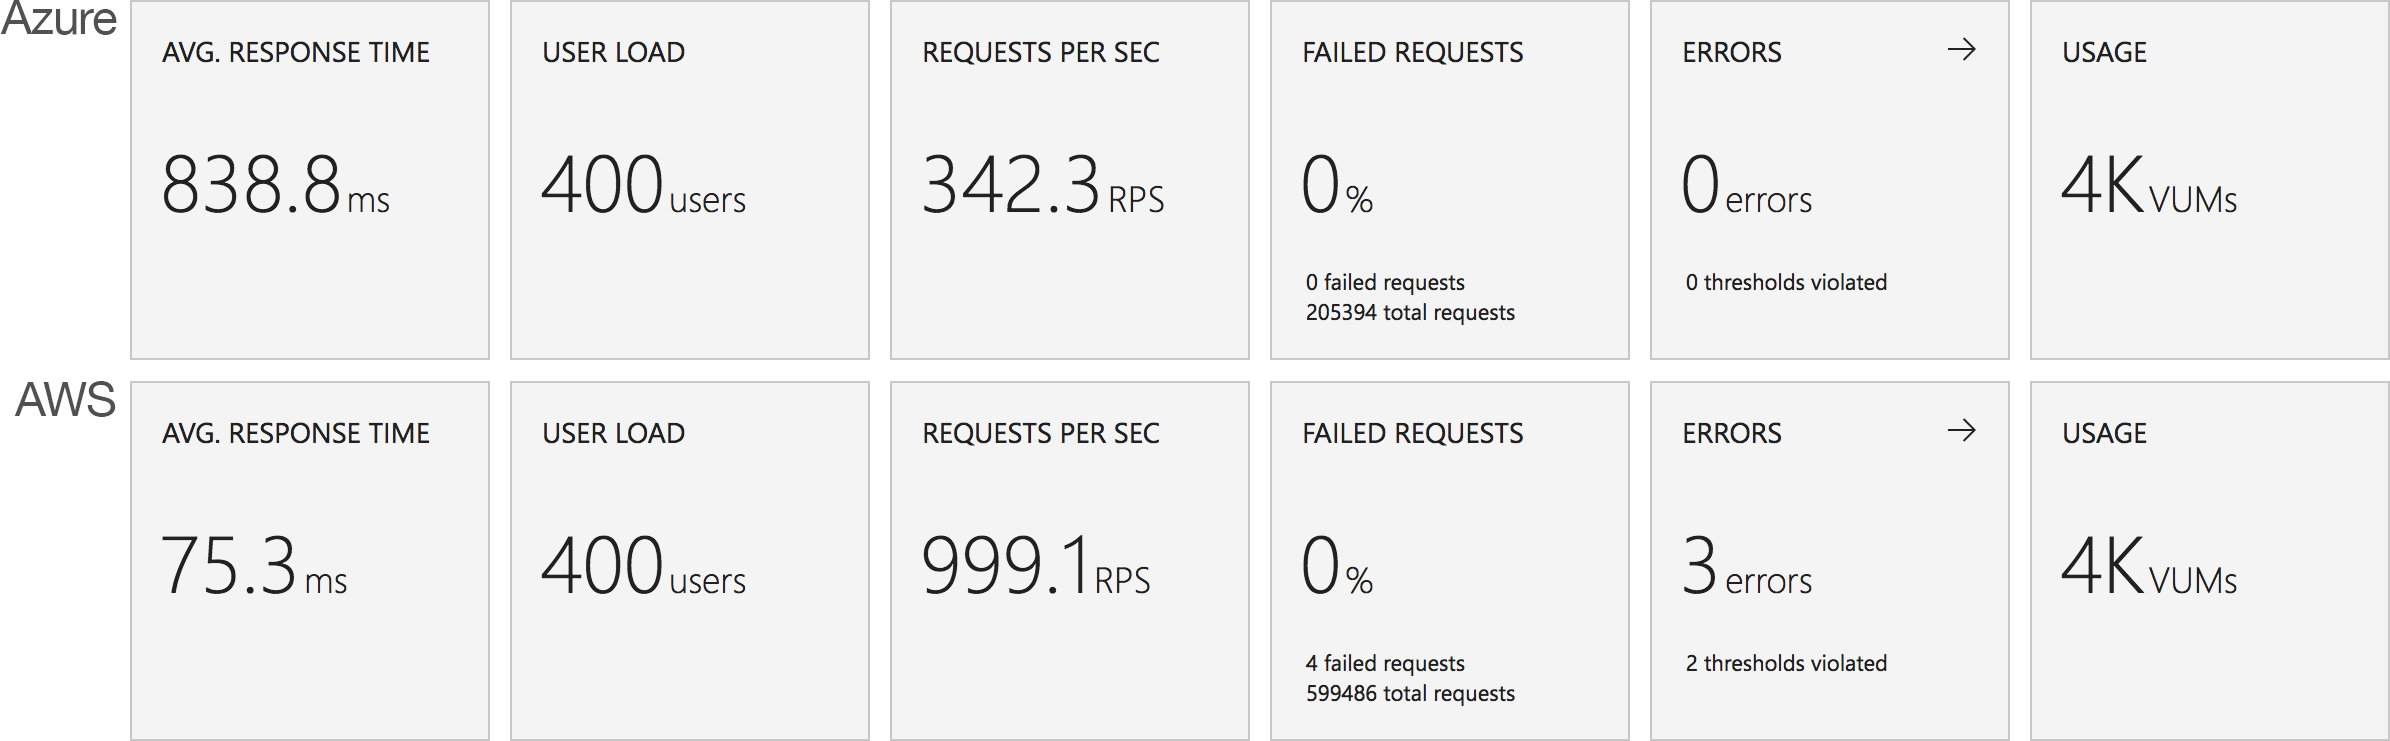
Again it’s striking just how improved the AWS stats over the Azure figures.

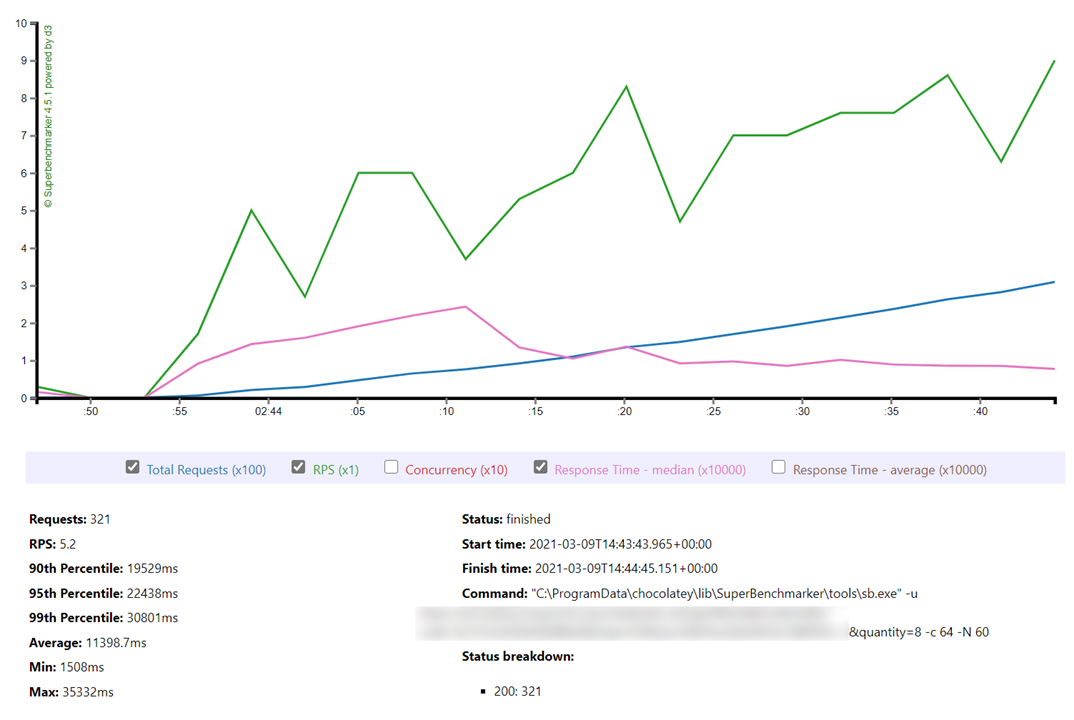
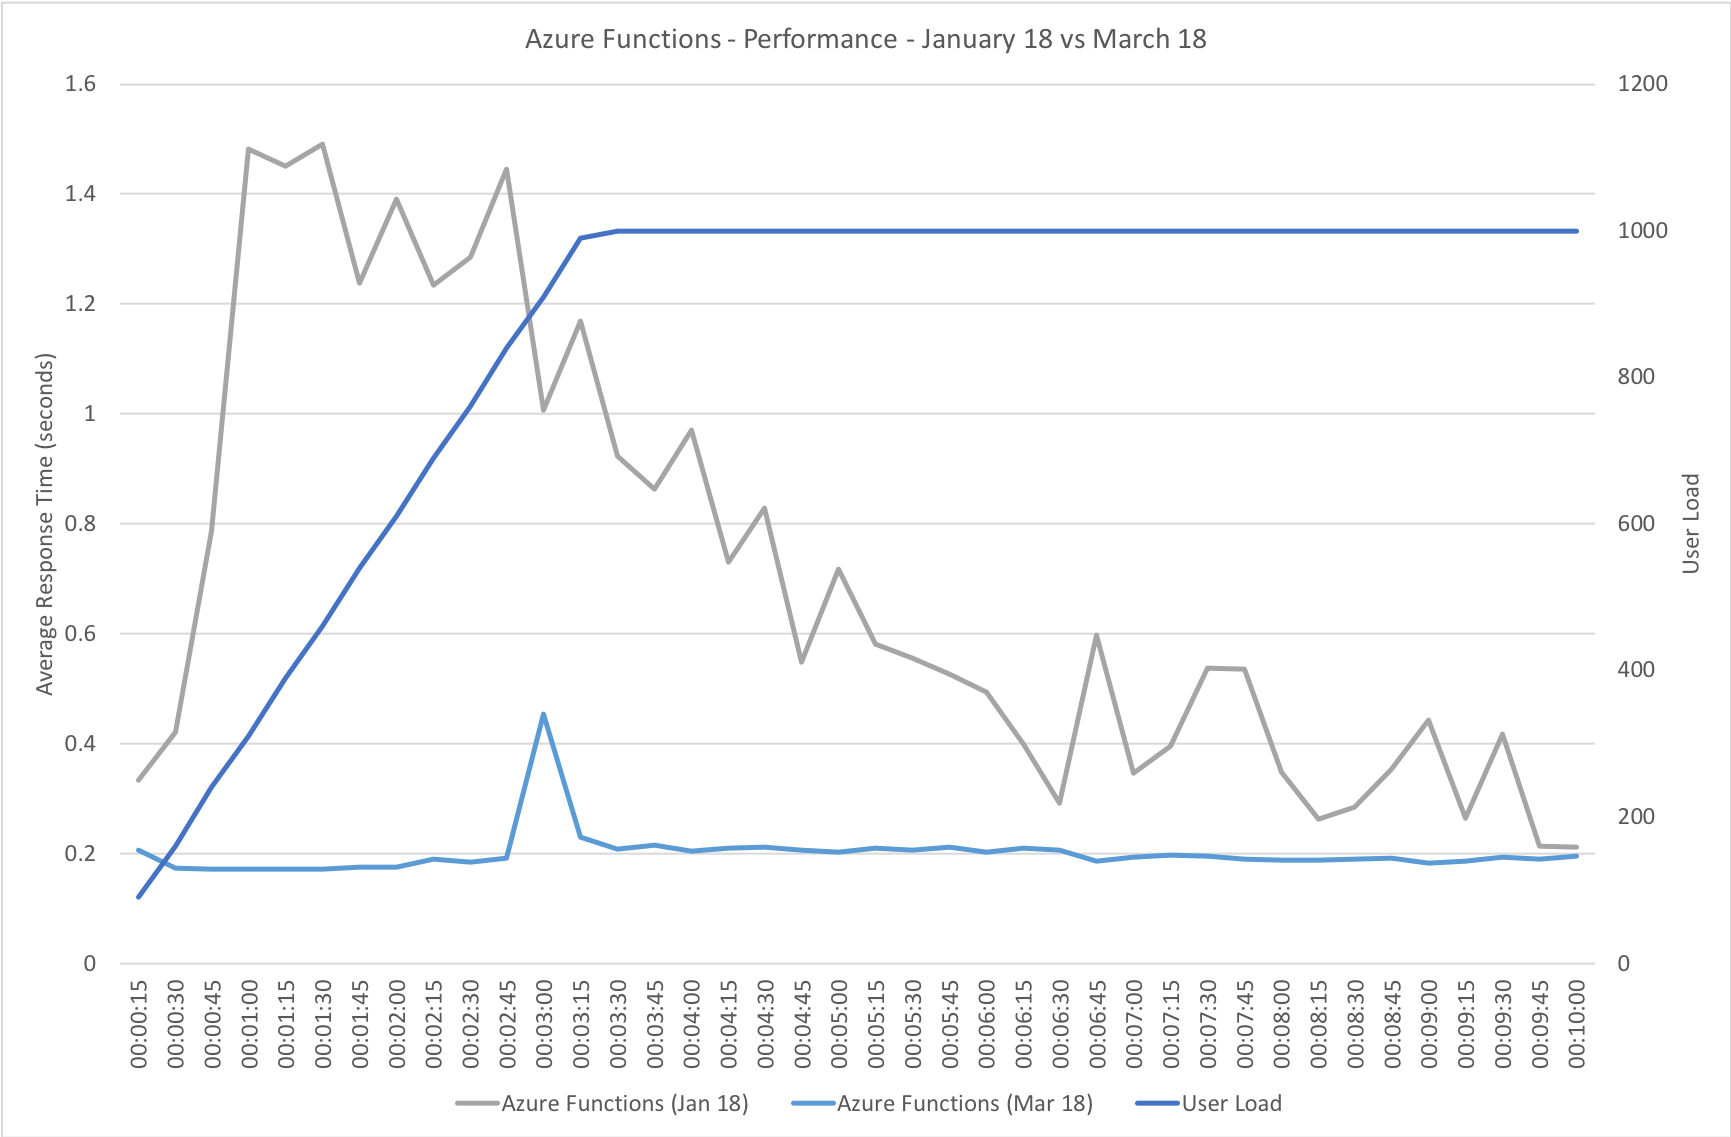
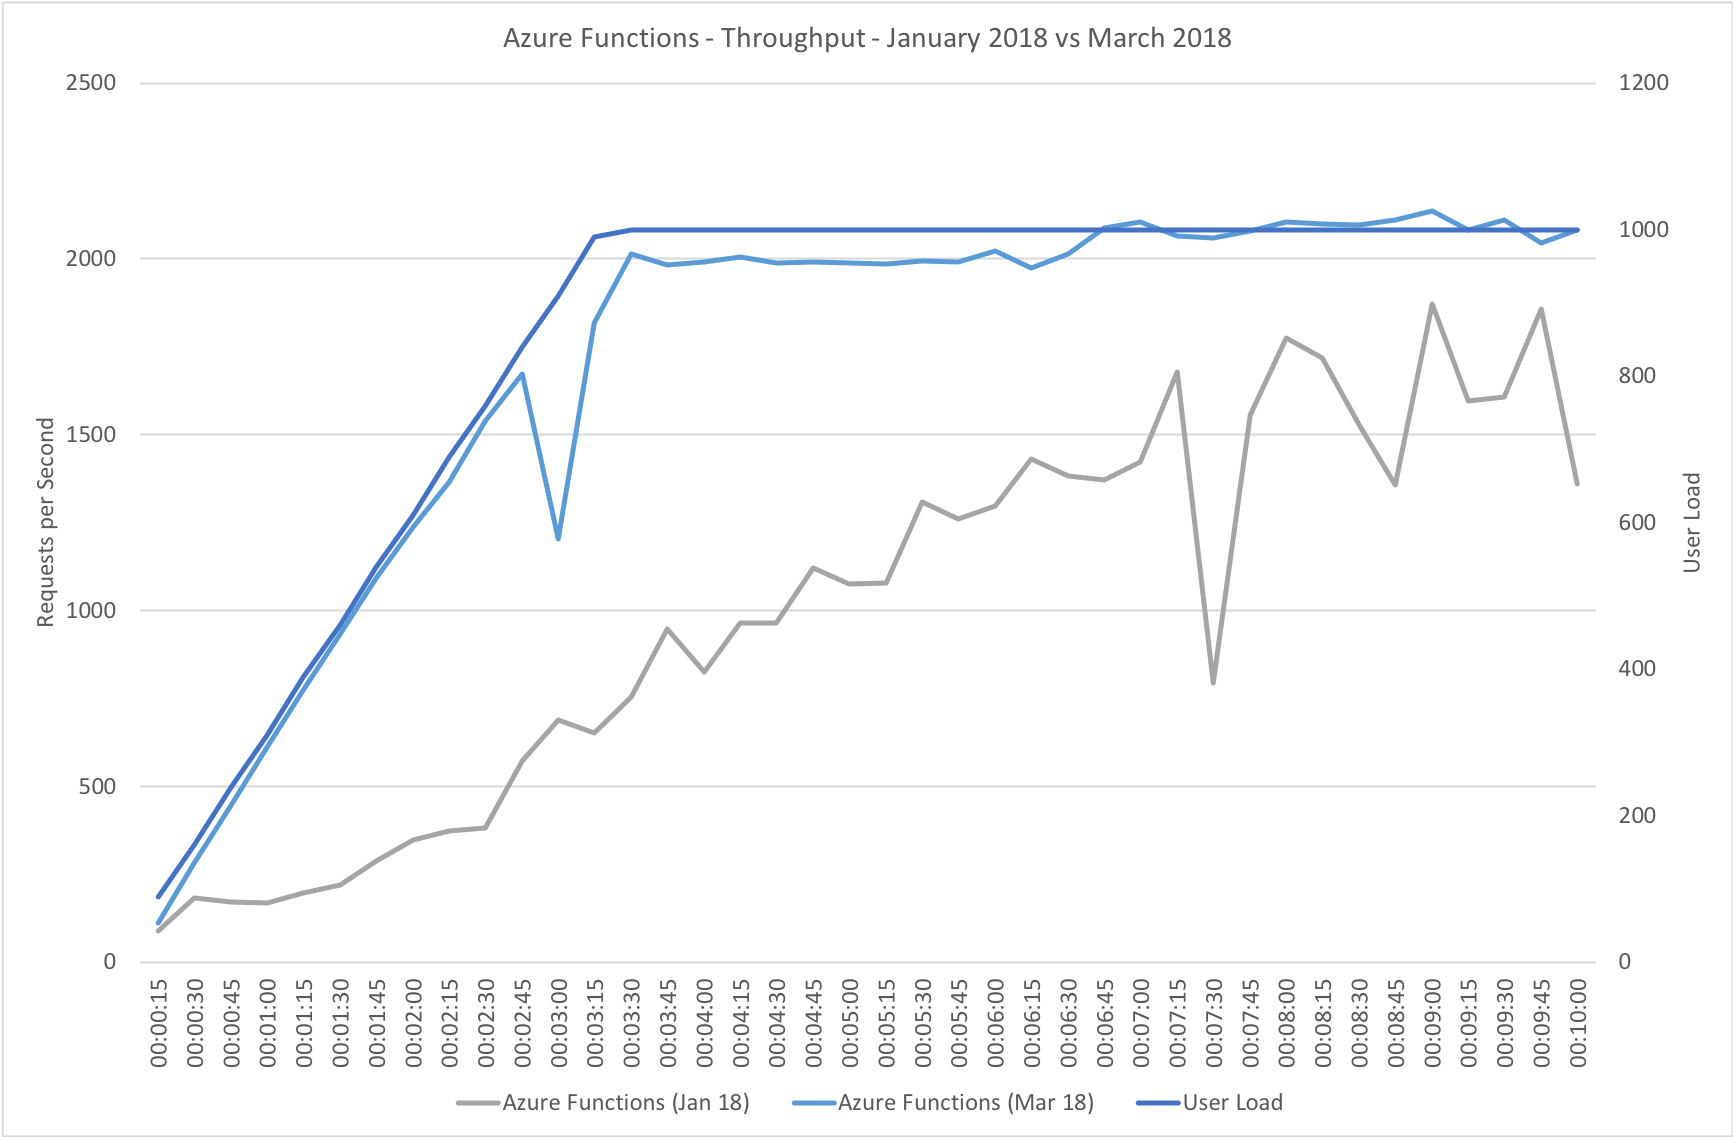
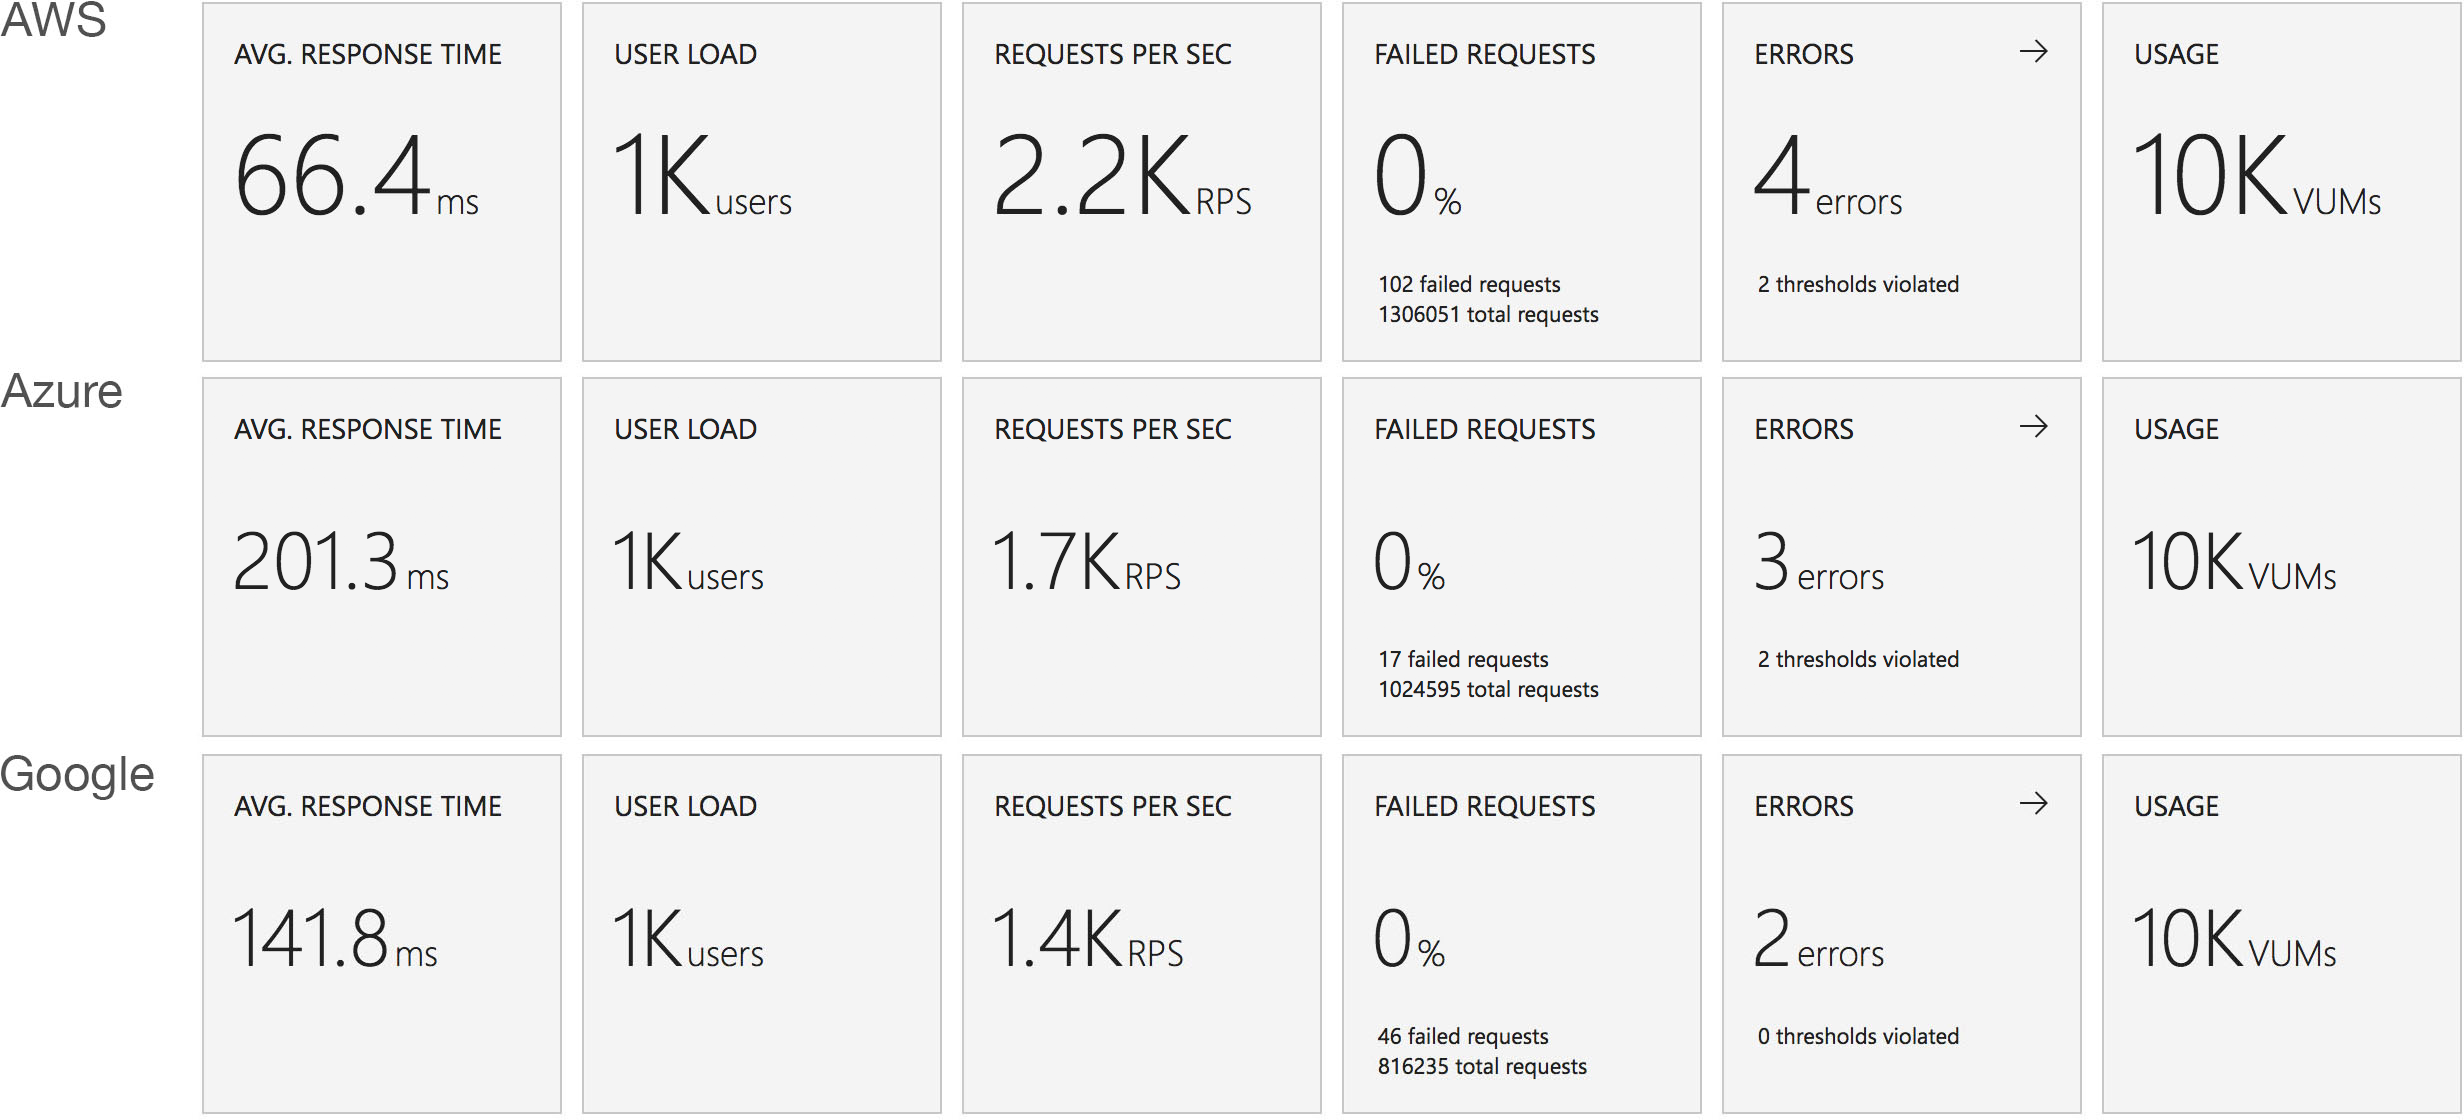
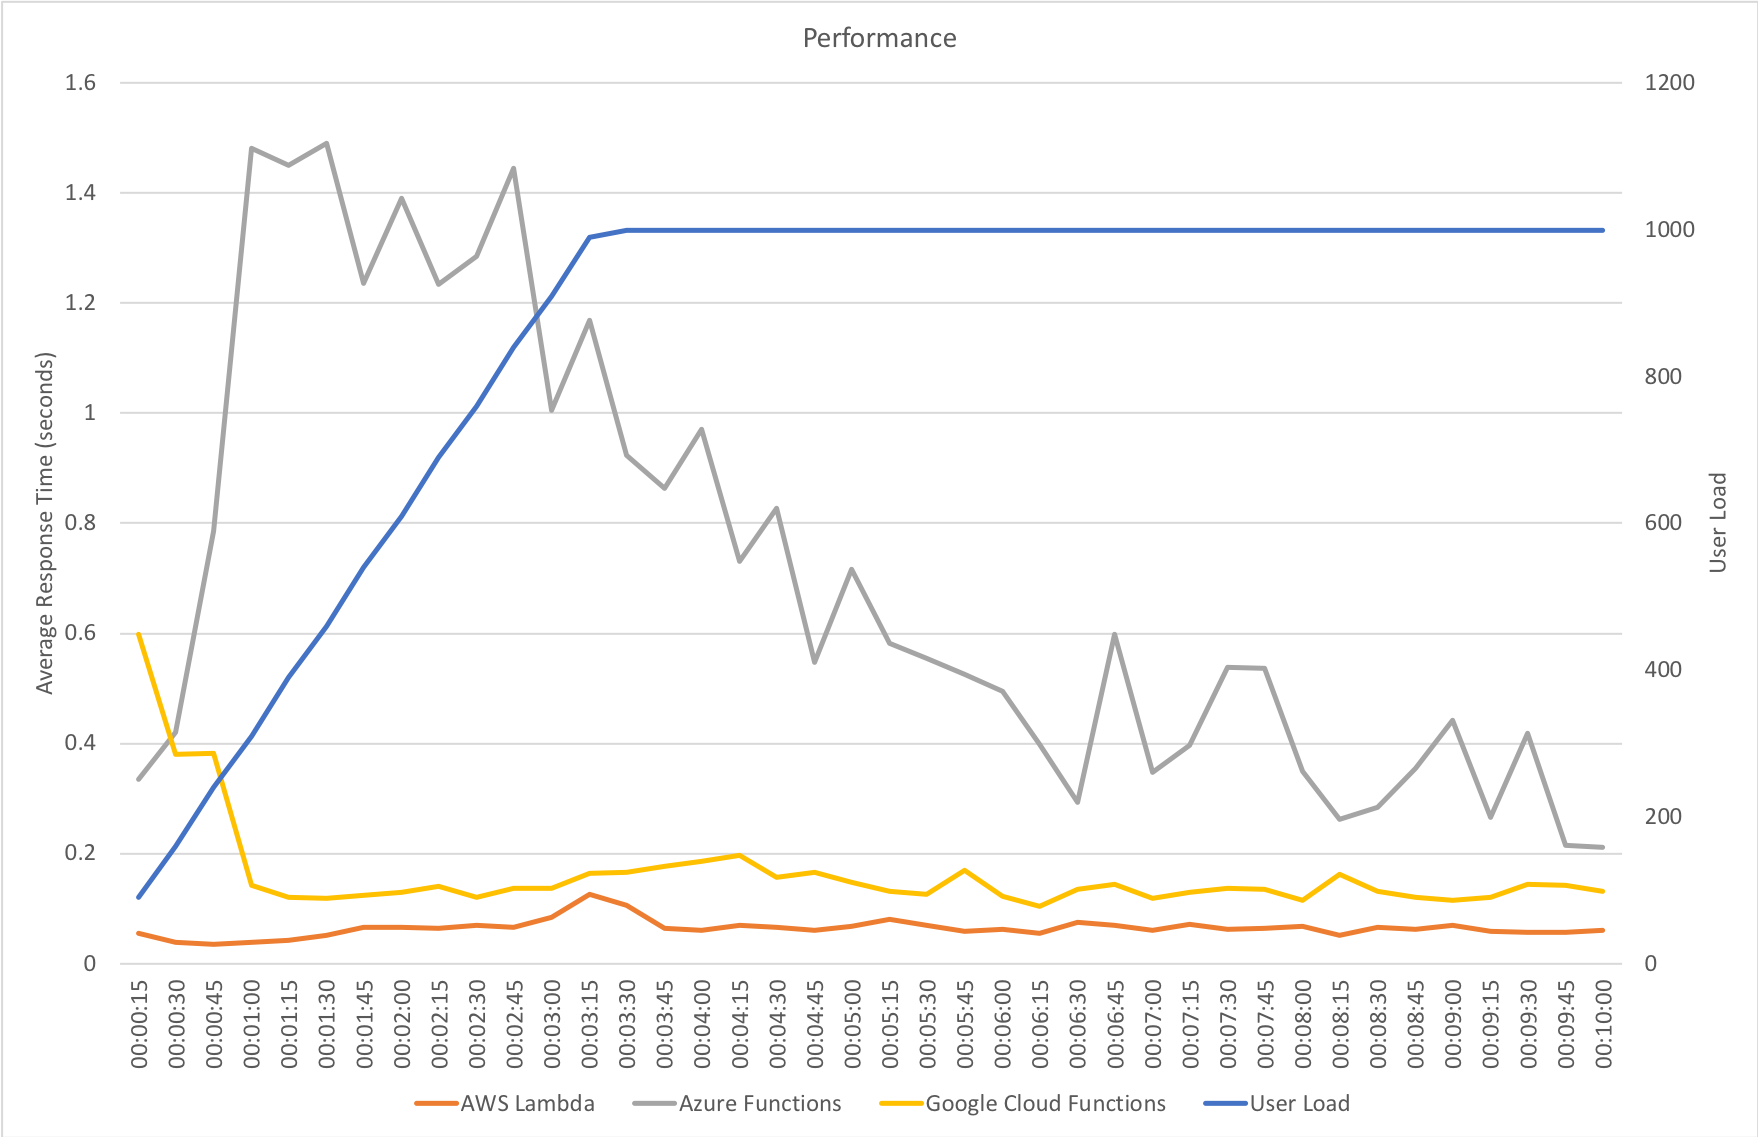
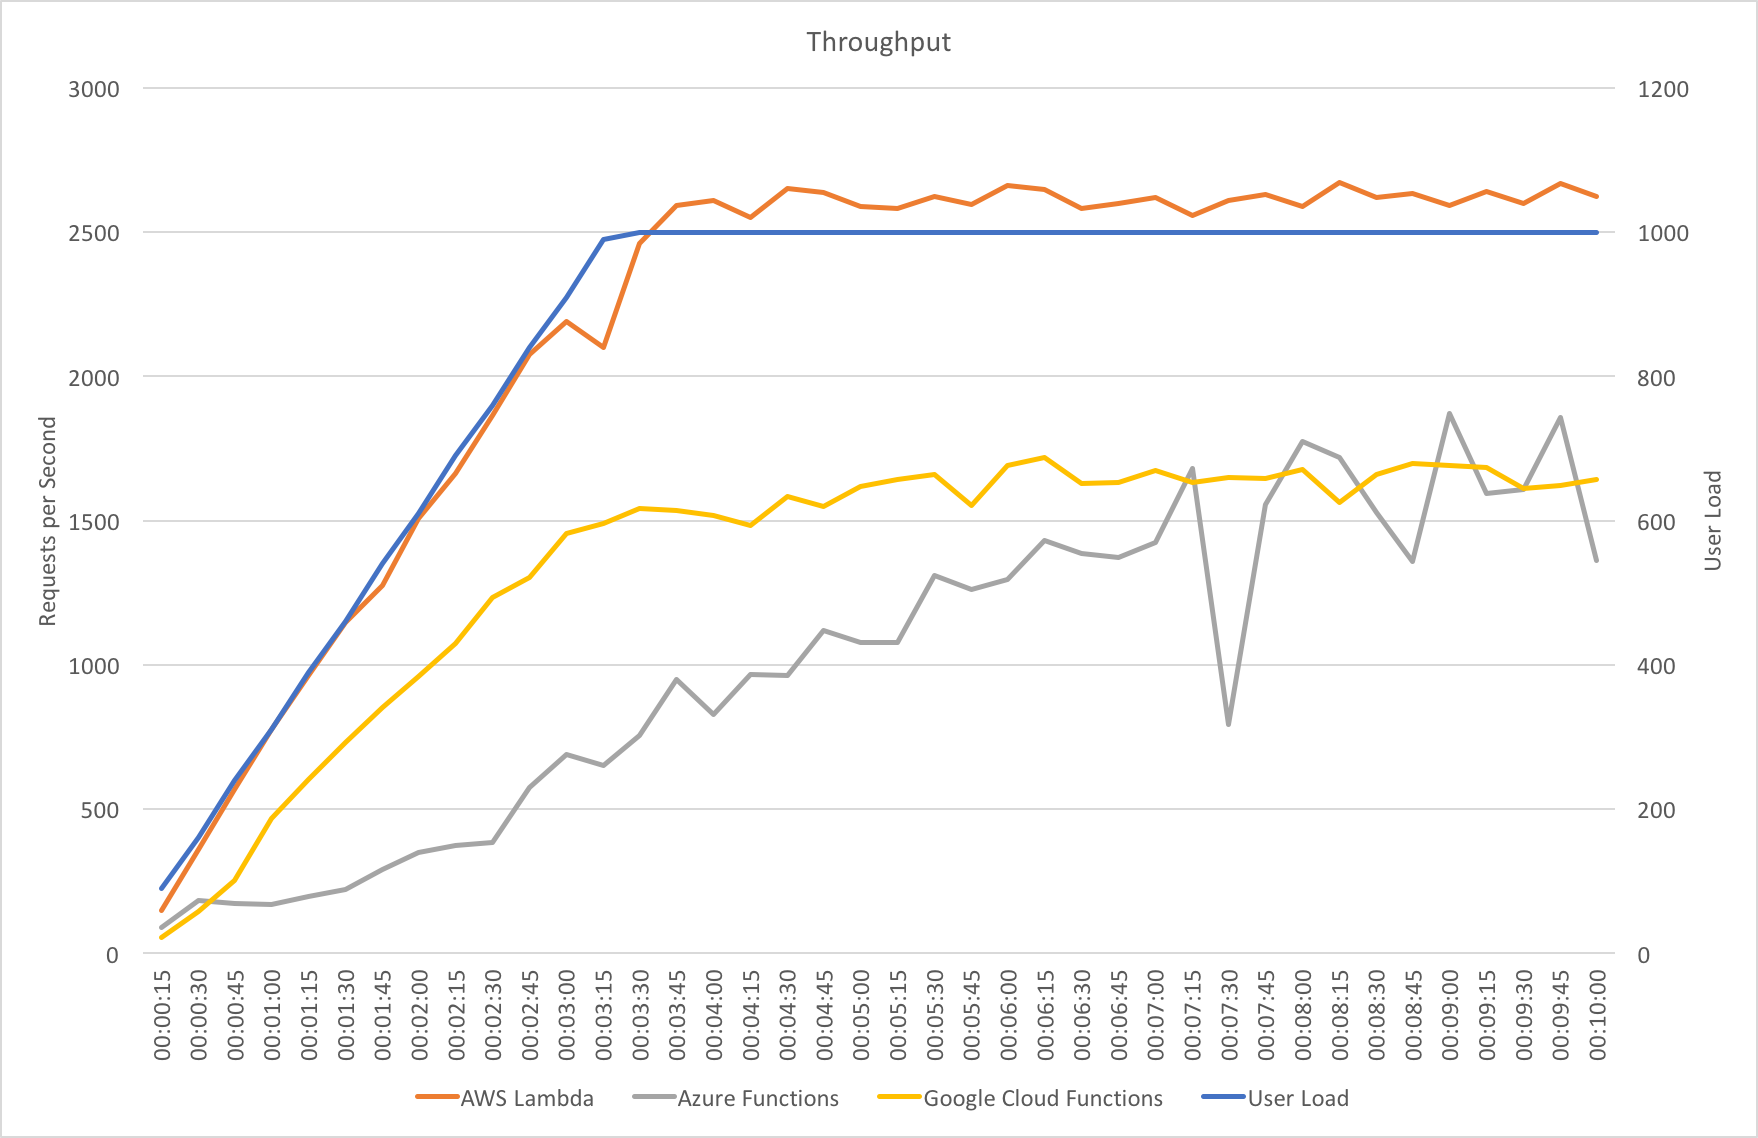
Constant Load of 1000 Concurrent Users

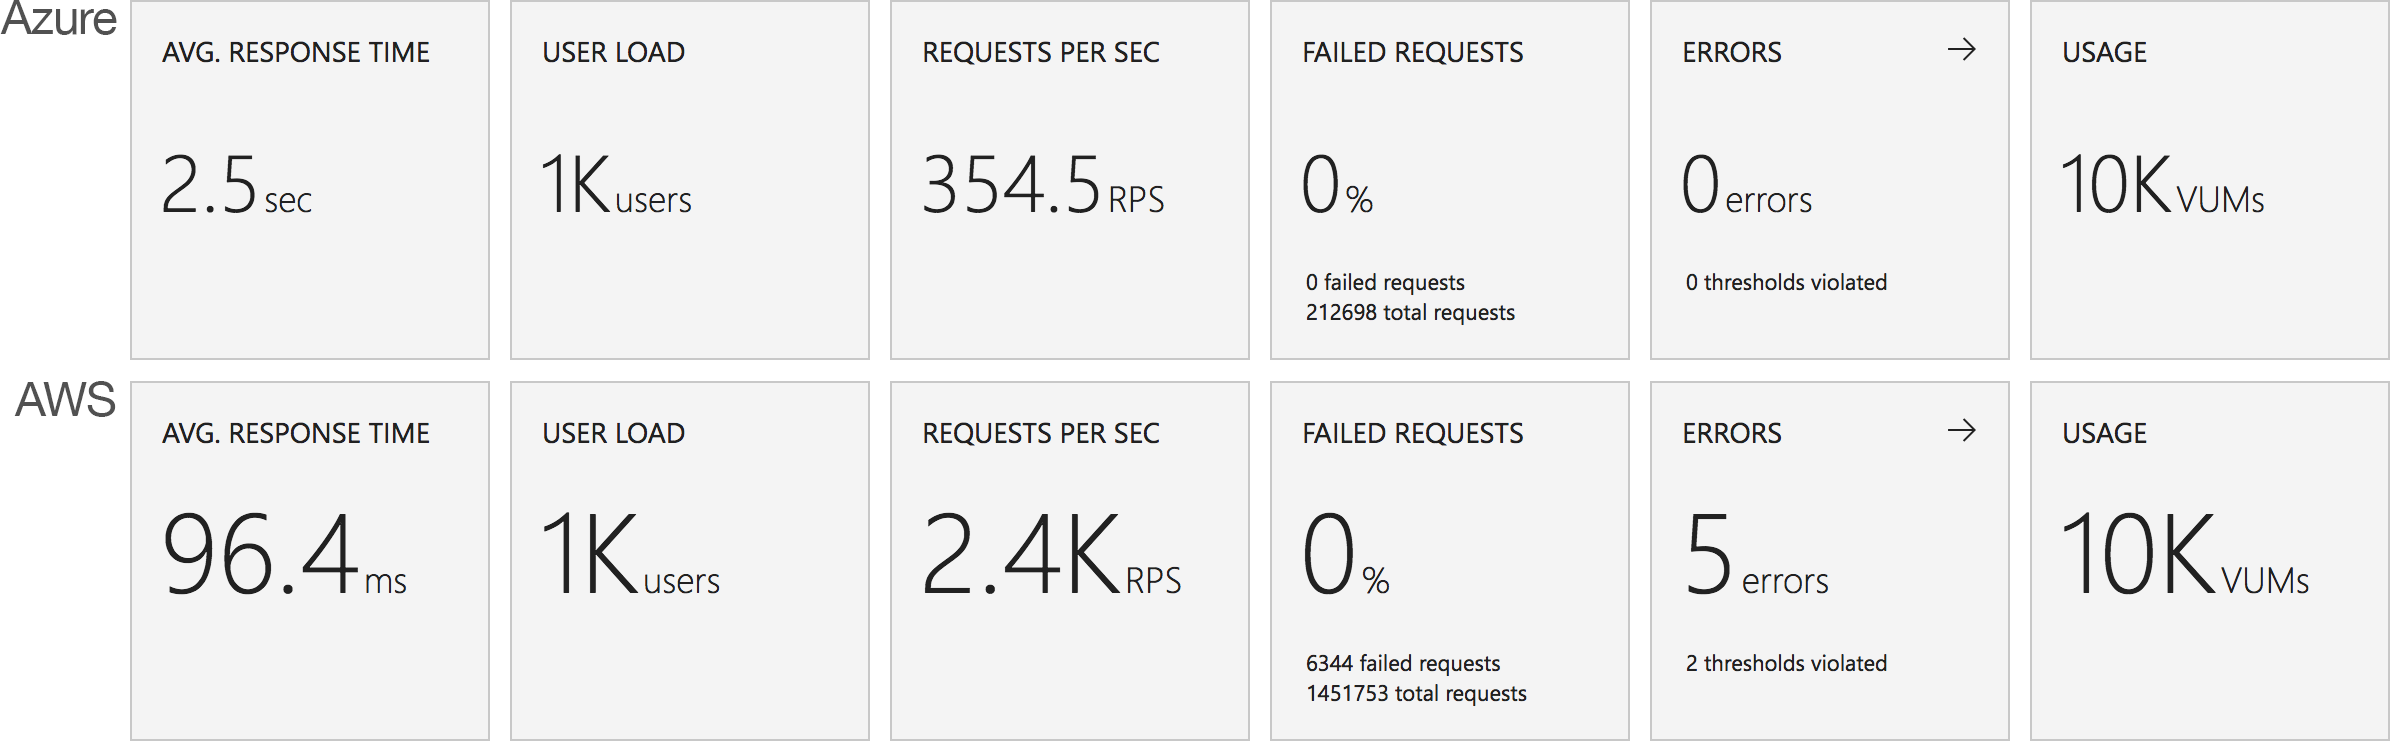
Same scenario as the last test but this time 1000 users. Lets get into the data:

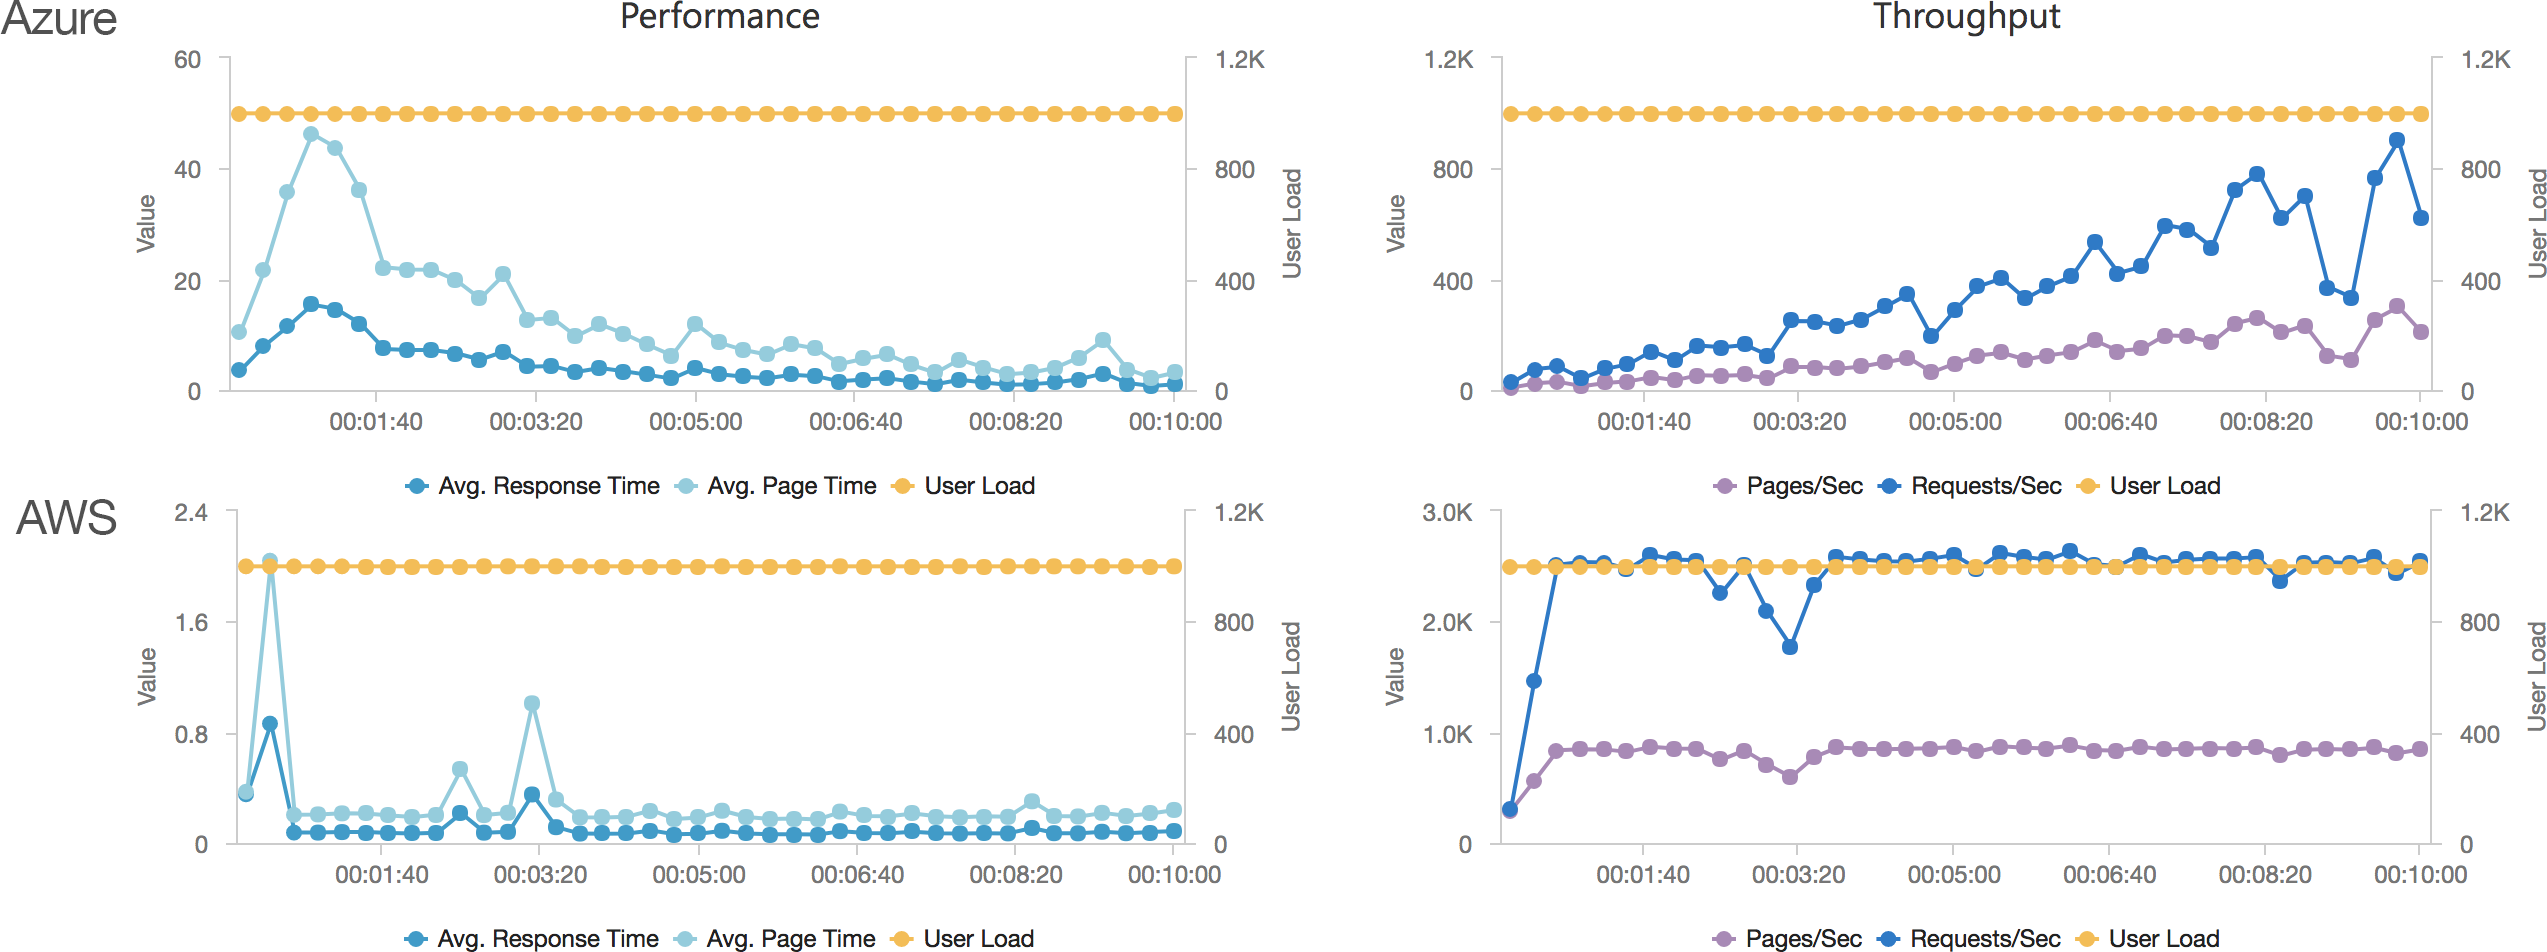
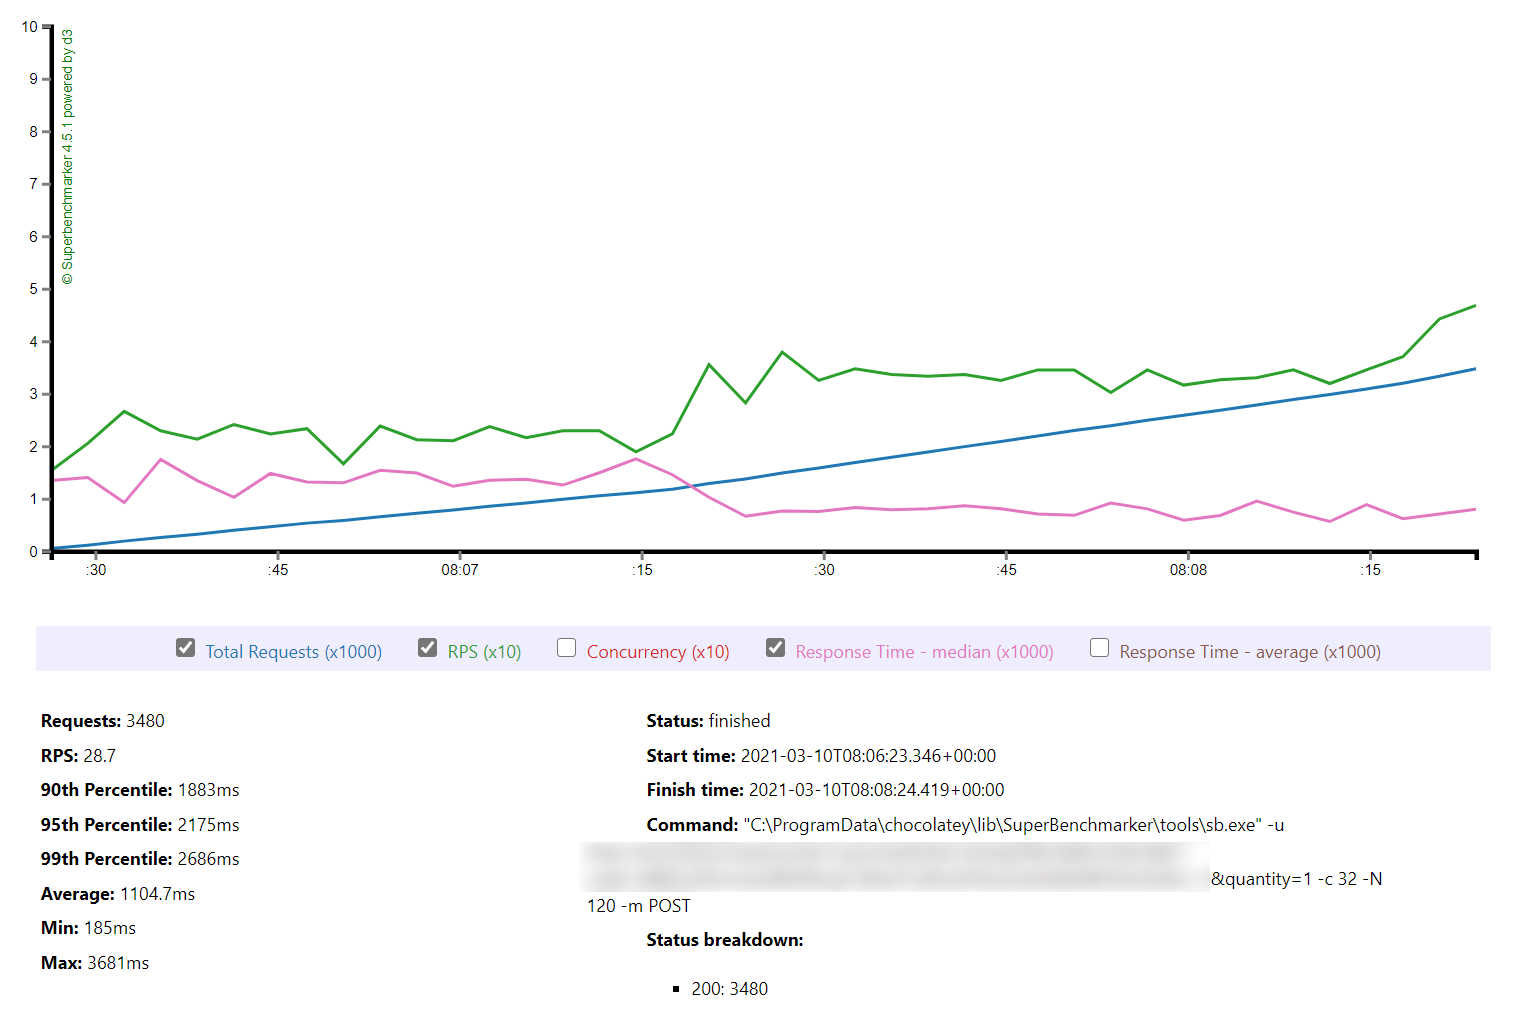
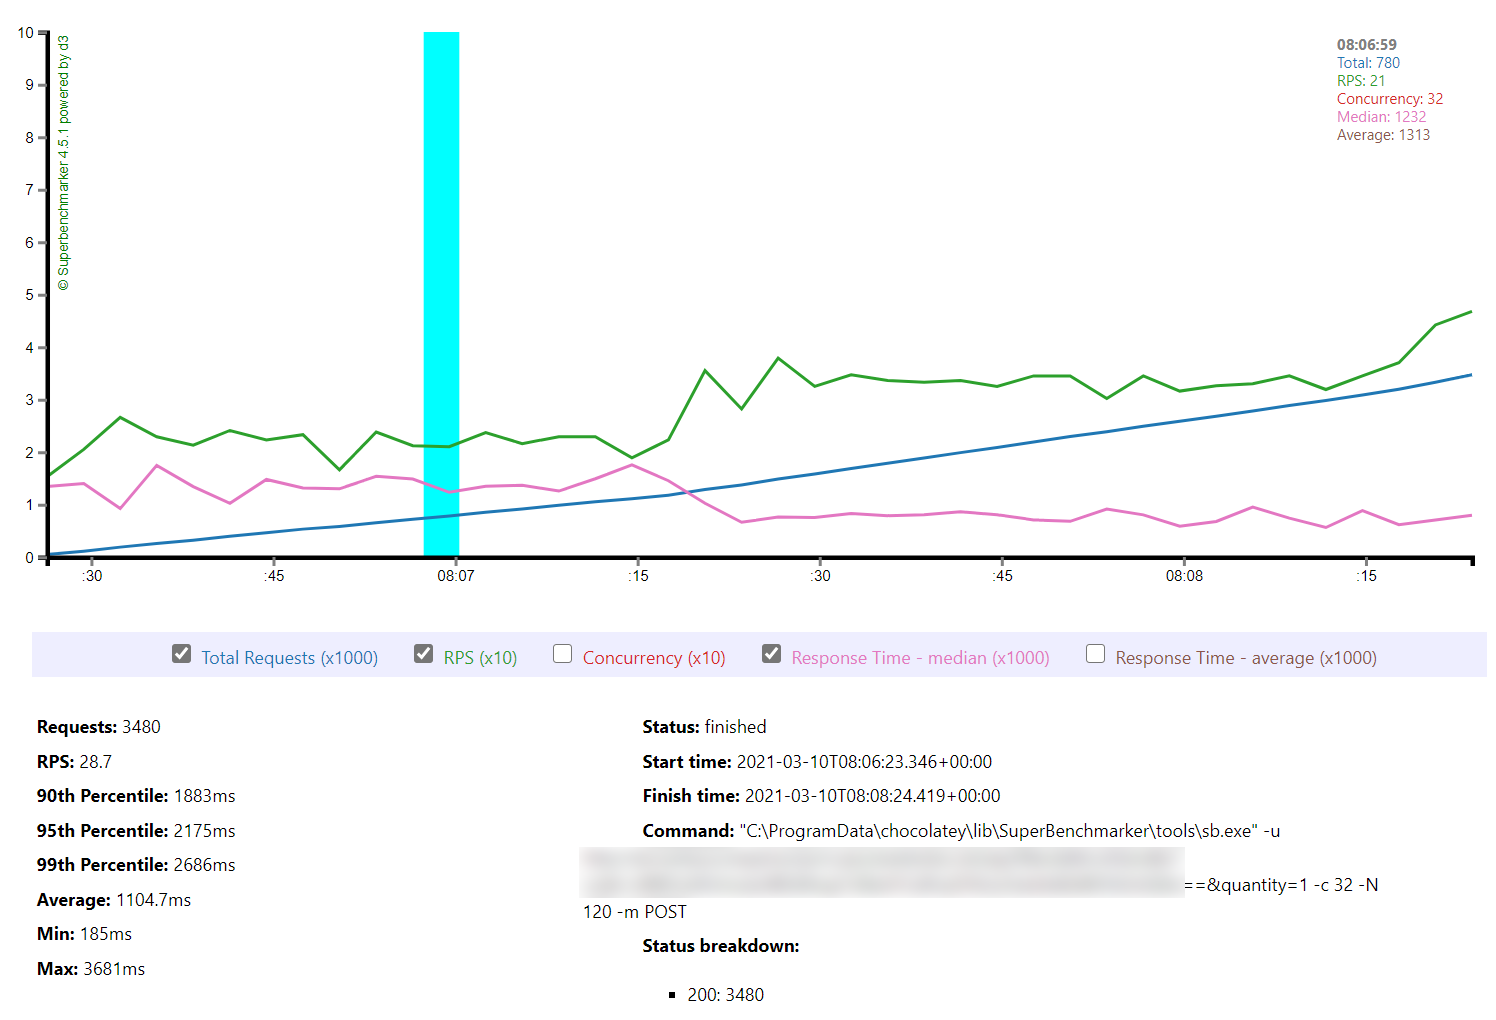
Again we can see a similar pattern with Azure slow to scale up to meet the demand while with AWS it is business as usual in under a minute. Interestingly at this level of concurrency AWS also error’d heavily during the early scaling:

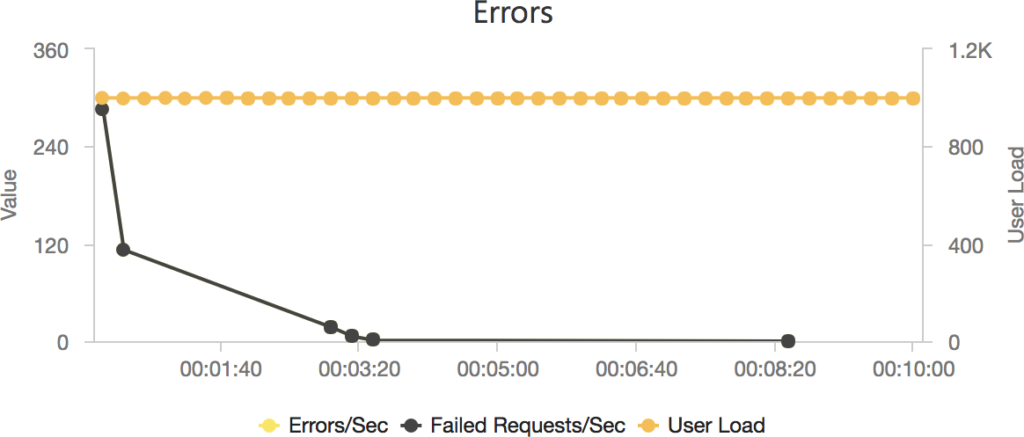
It should be noted that AWS specifically instructs you to implement retry and backoff handlers on the client which in the load test I am not doing, additionally at this point I am seeing throttle events in the logging for the AWS function – this is something I will look to come back to in the future. However its interesting to note the contrasting approaches of the two systems: Azure inflates it’s response time while AWS prefers to throw errors.

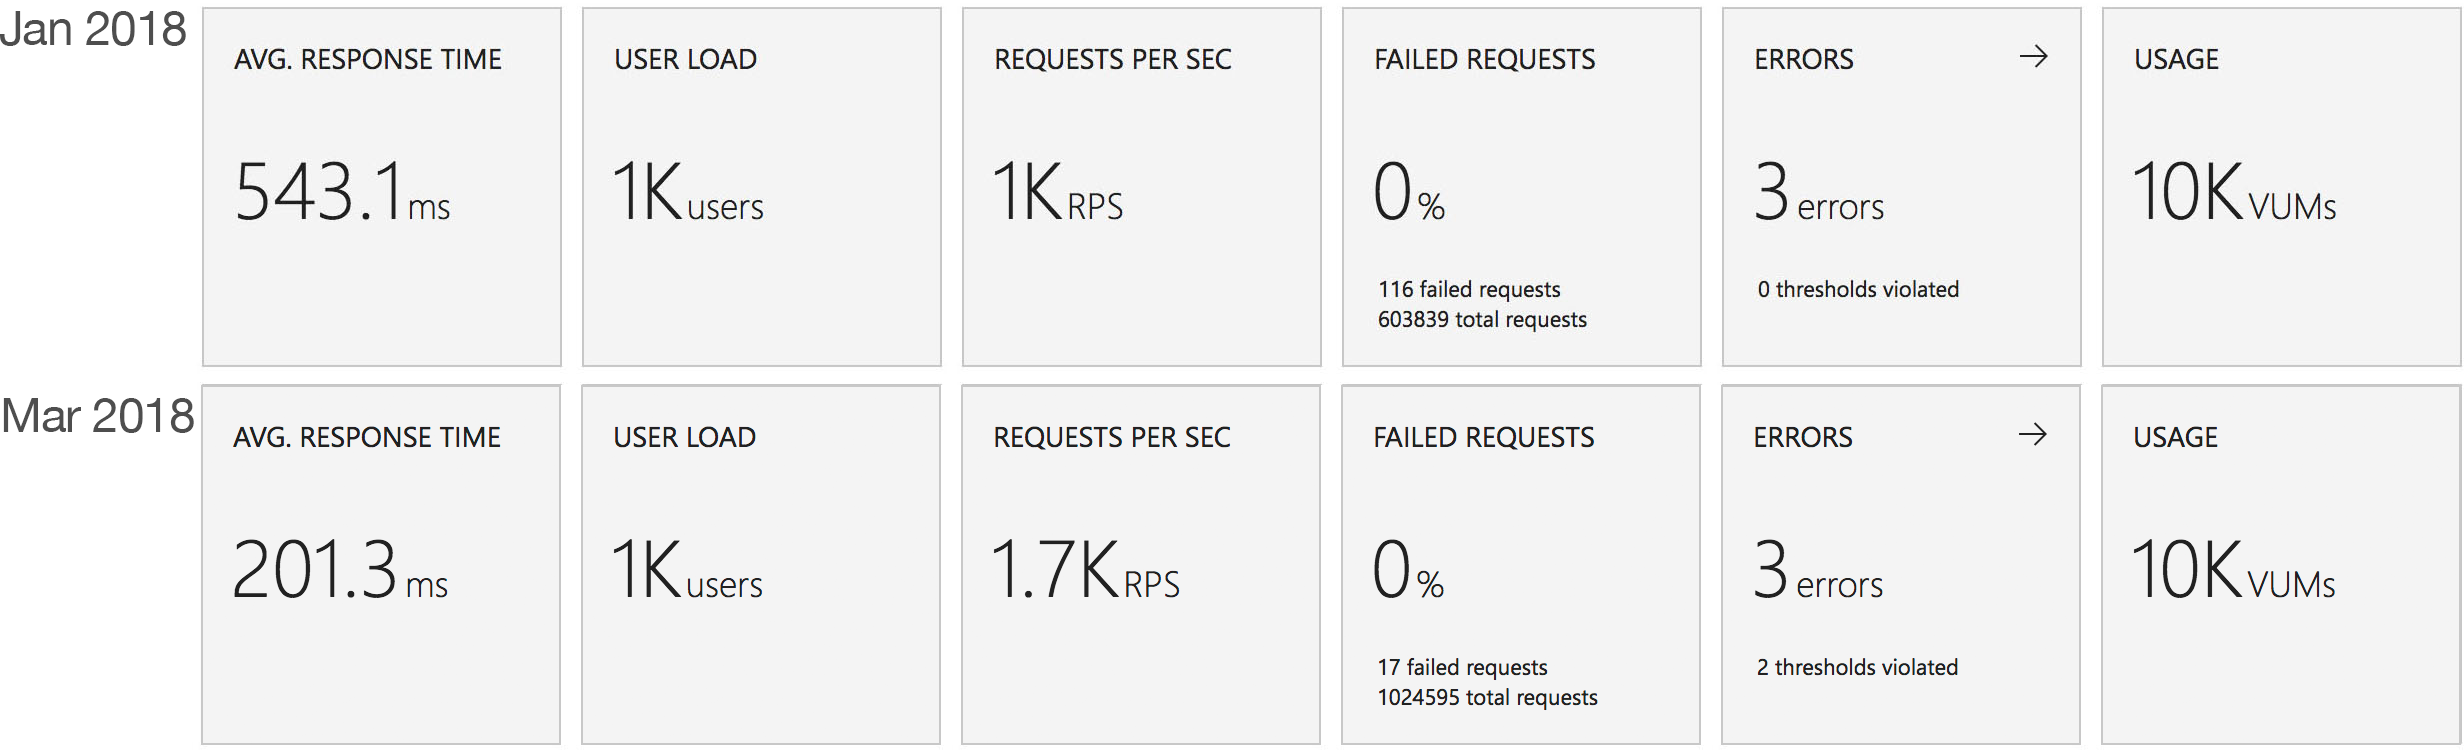
The average stats for the run:

Azure Functions

I don’t think there’s much point dancing around the issue: the above numbers are disappointing. Azure is slow to scale it’s HTTP triggered functions and once we get beyond the 100 concurrent users point the response times are never great and the experience is generally uneven. For customer facing API / web serving where low latency and response time are critical to a smooth user experience this really rules it out as an option. And it’s not just the .NET 4.6 variant that is poor as can be seen from my previous posts where I stripped test cases down to the most basic scenarios and used a variety of frameworks. The best case for Azure scaling I’ve found is using a CSX approach to return a string but even that lags behind AWS doing real work as the test cases in this post do:

using System.Net;

public static async Task<HttpResponseMessage> Run(HttpRequestMessage req, TraceWriter log)
{
    log.Info("C# HTTP trigger function processed a request.");

    var response = req.CreateResponse();
    response.StatusCode = HttpStatusCode.OK;
    response.Content = new StringContent("<html><head><title>Blog</title></head><body>Hello world</body></html>", System.Text.Encoding.UTF8, "text/html");

    return response;
}

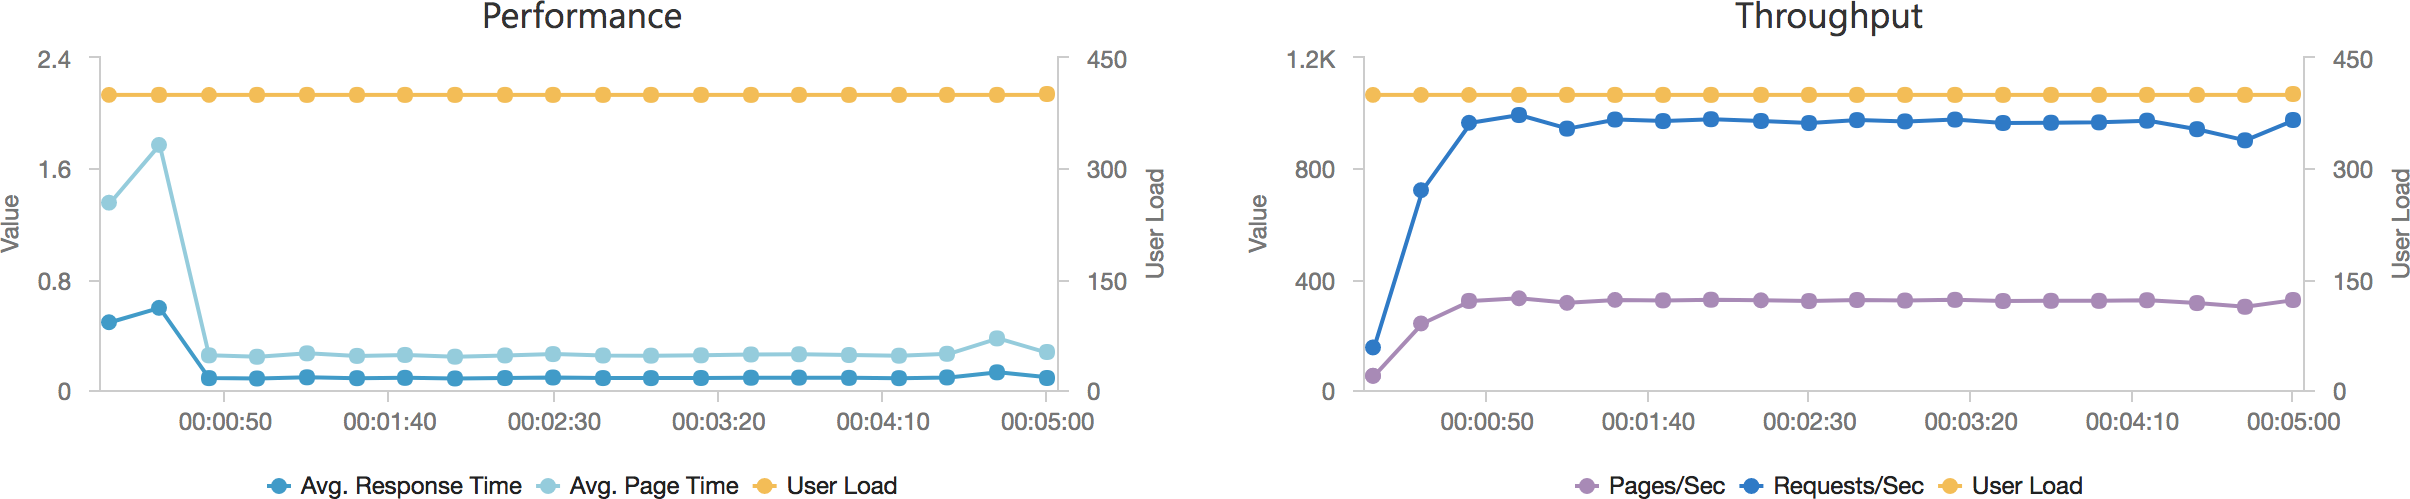
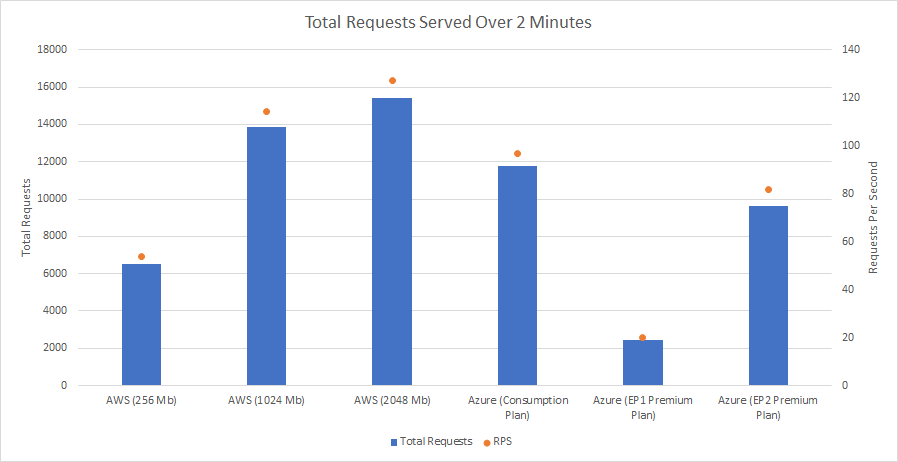
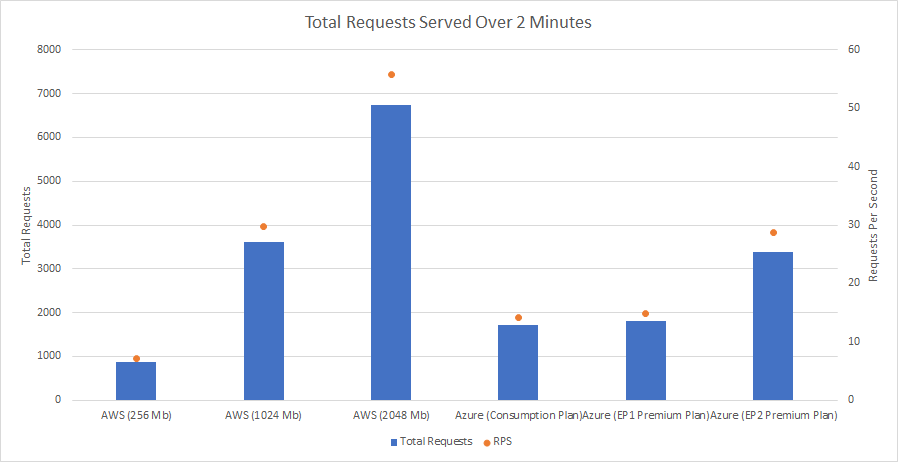
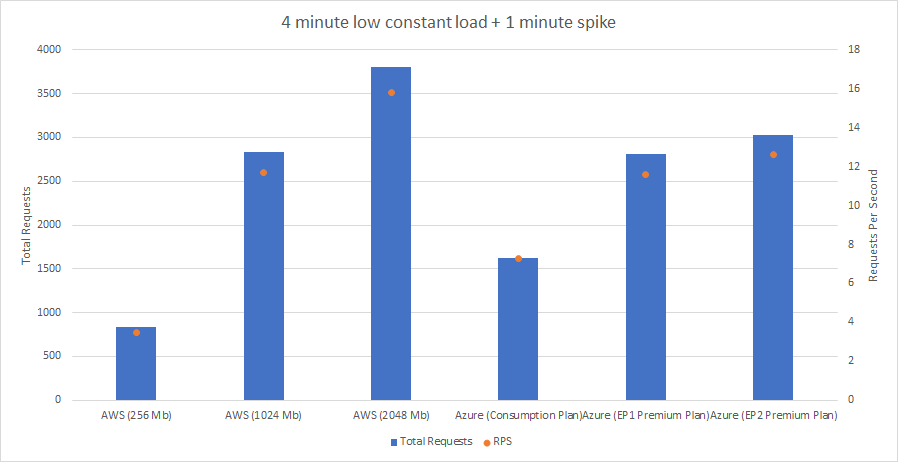
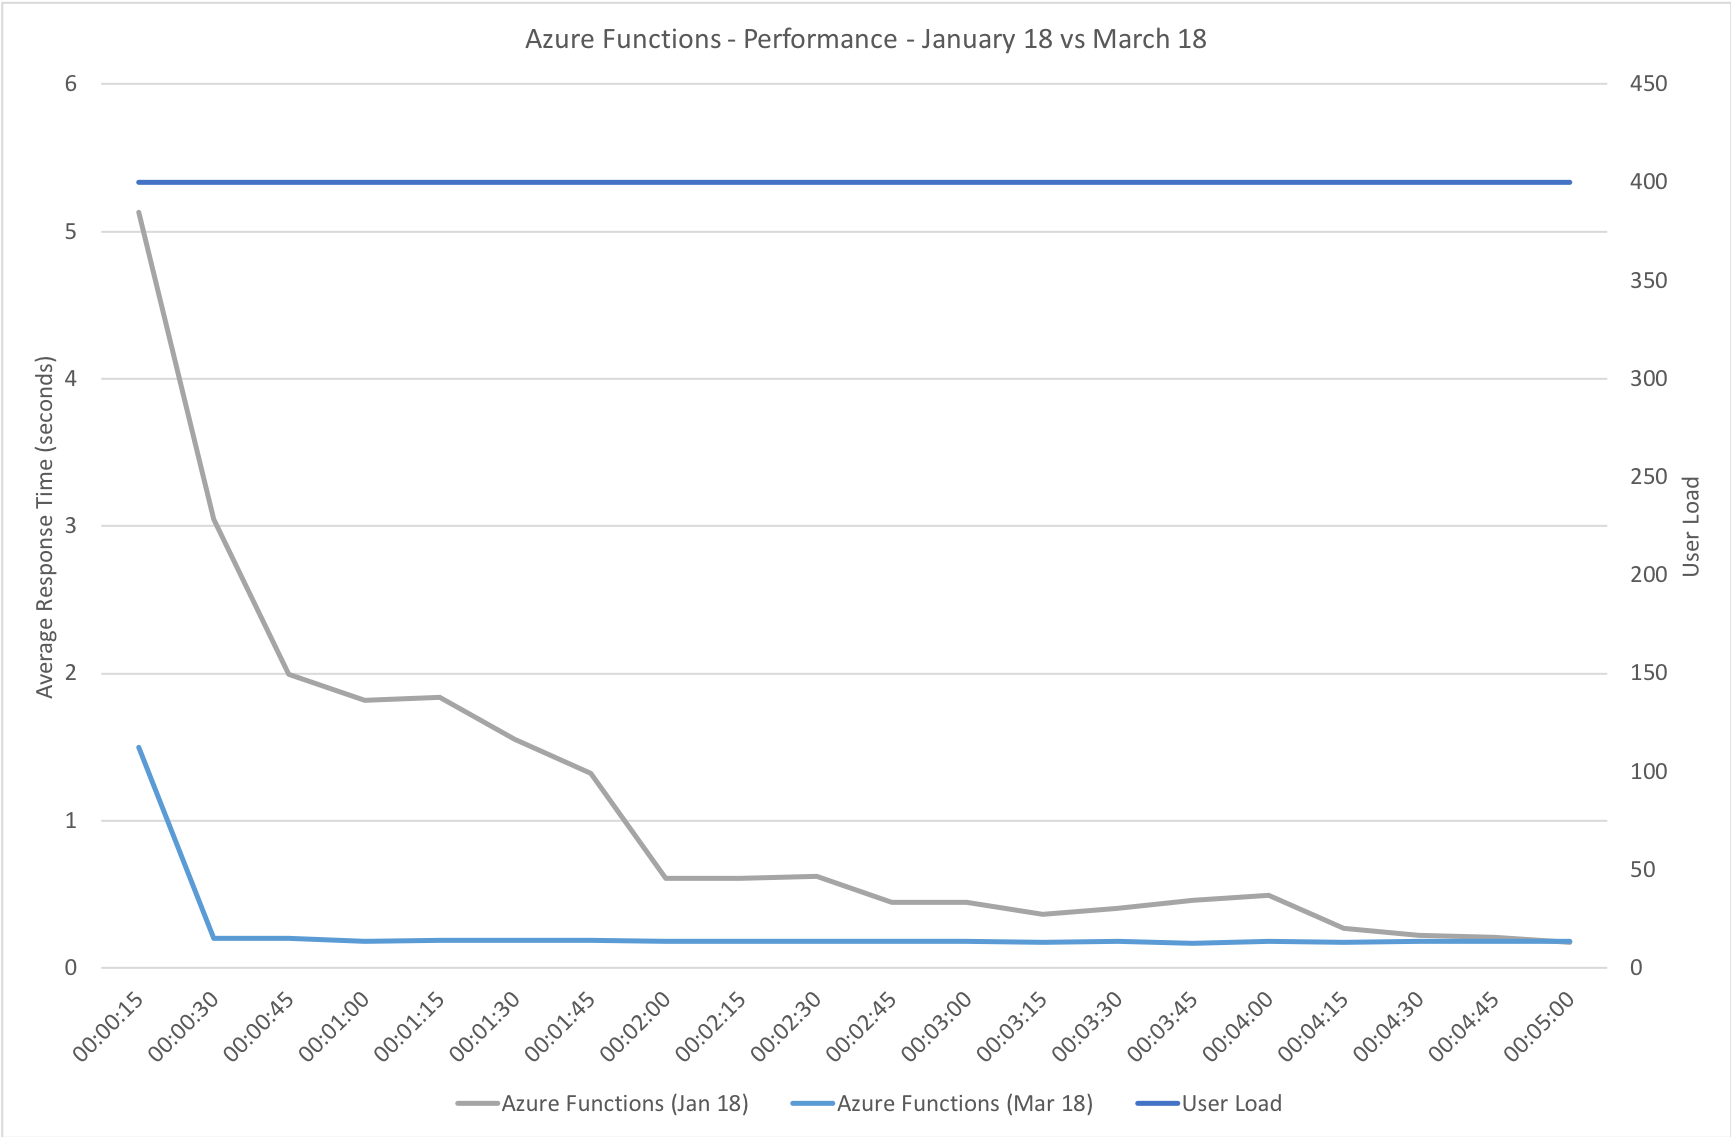
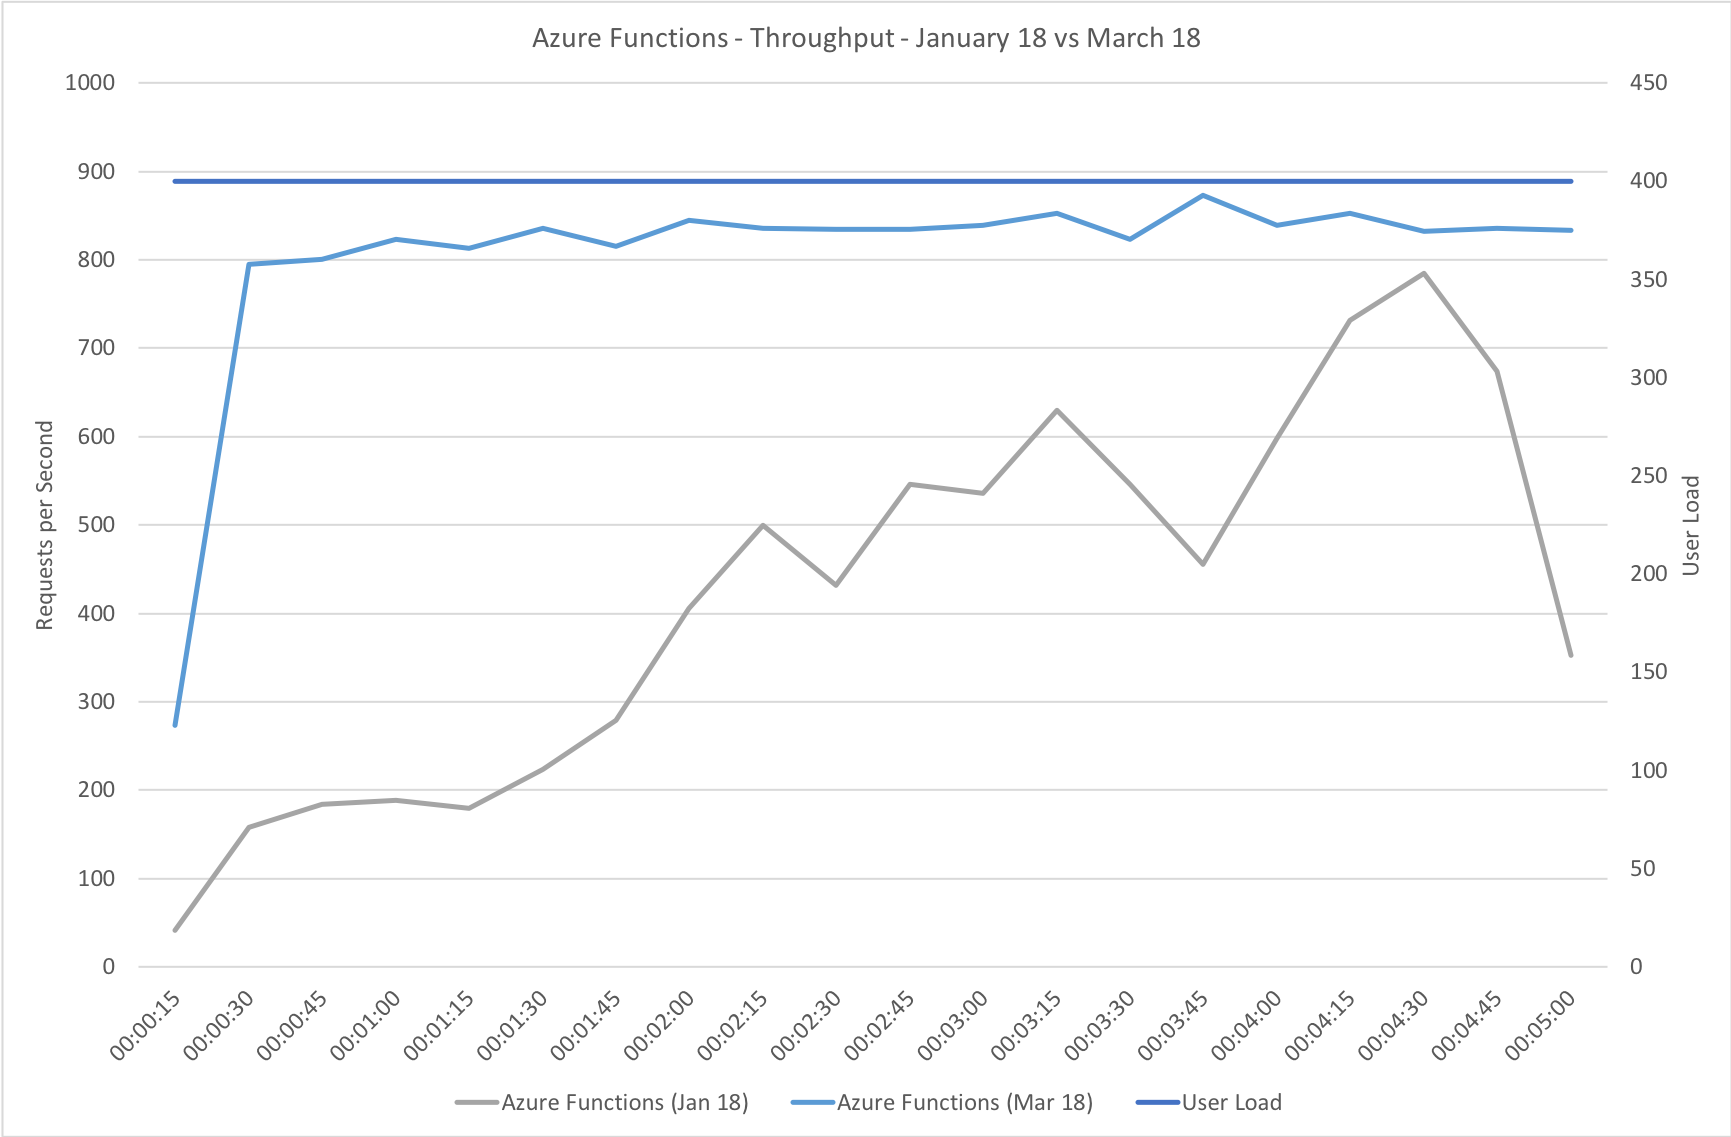
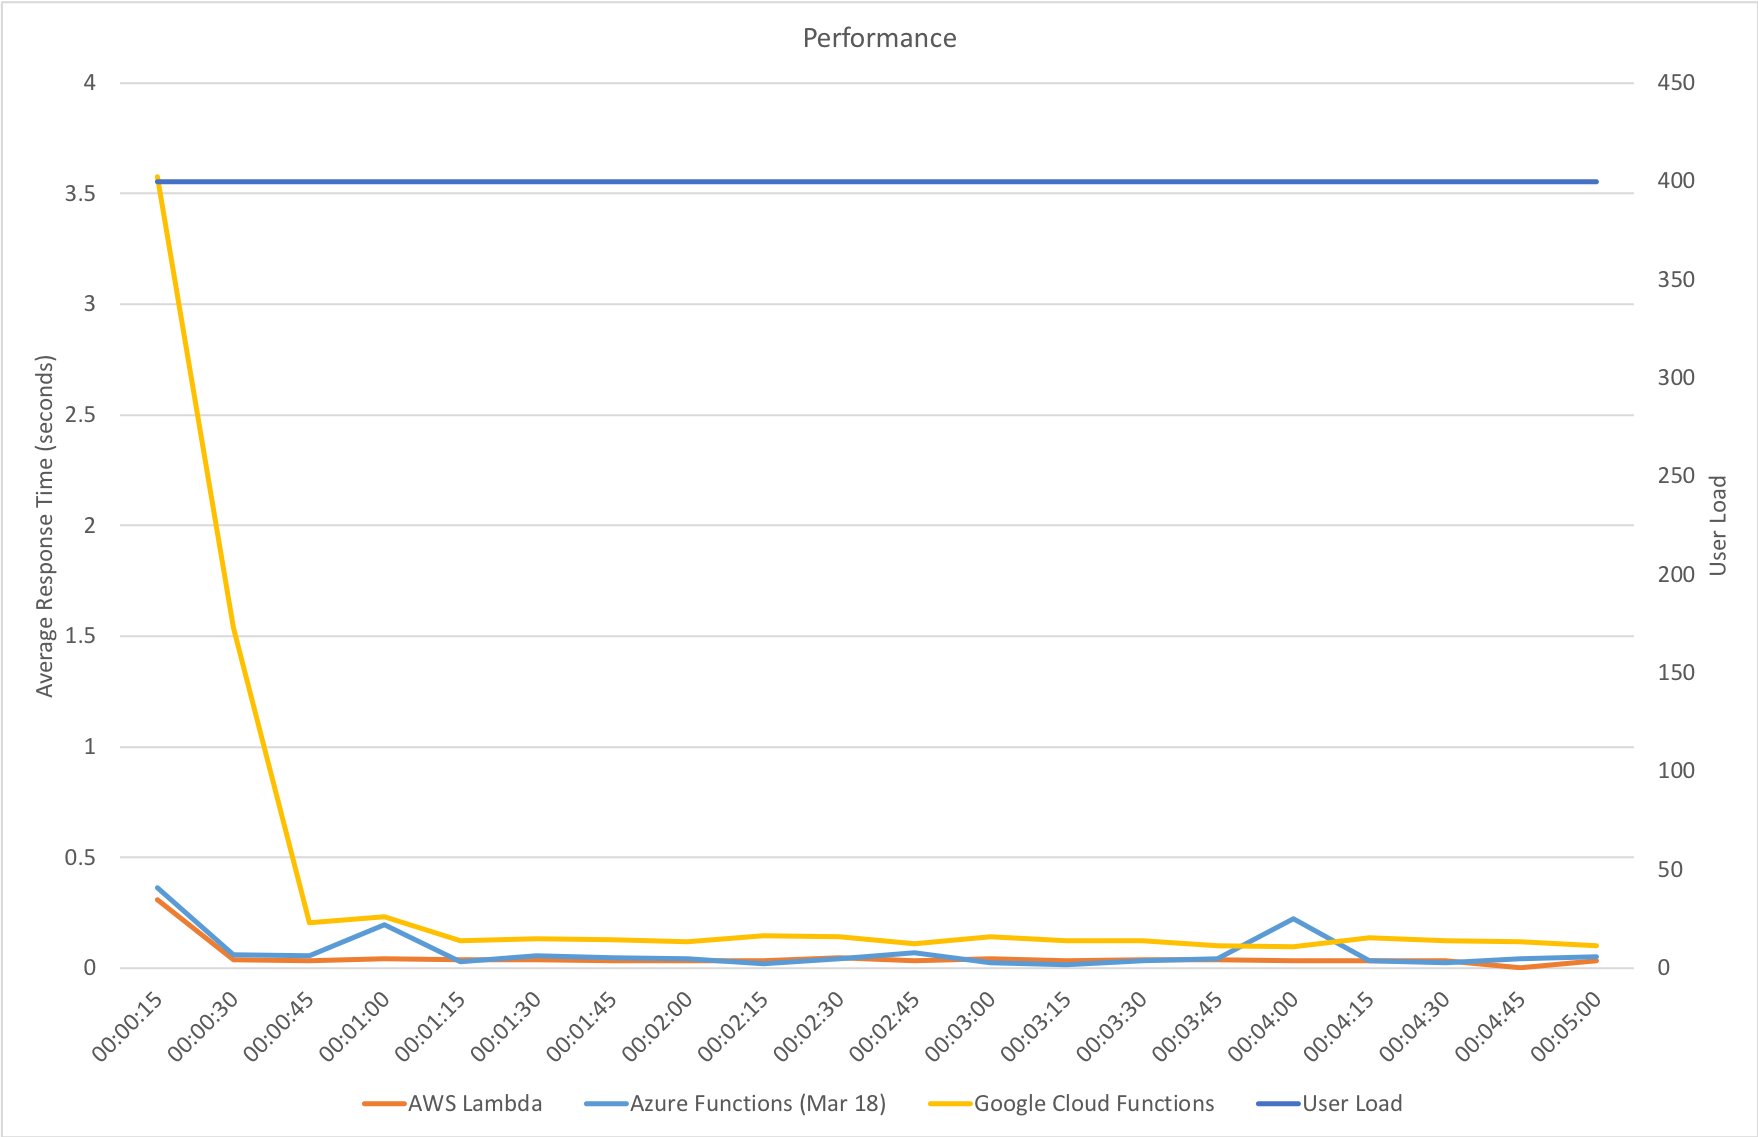
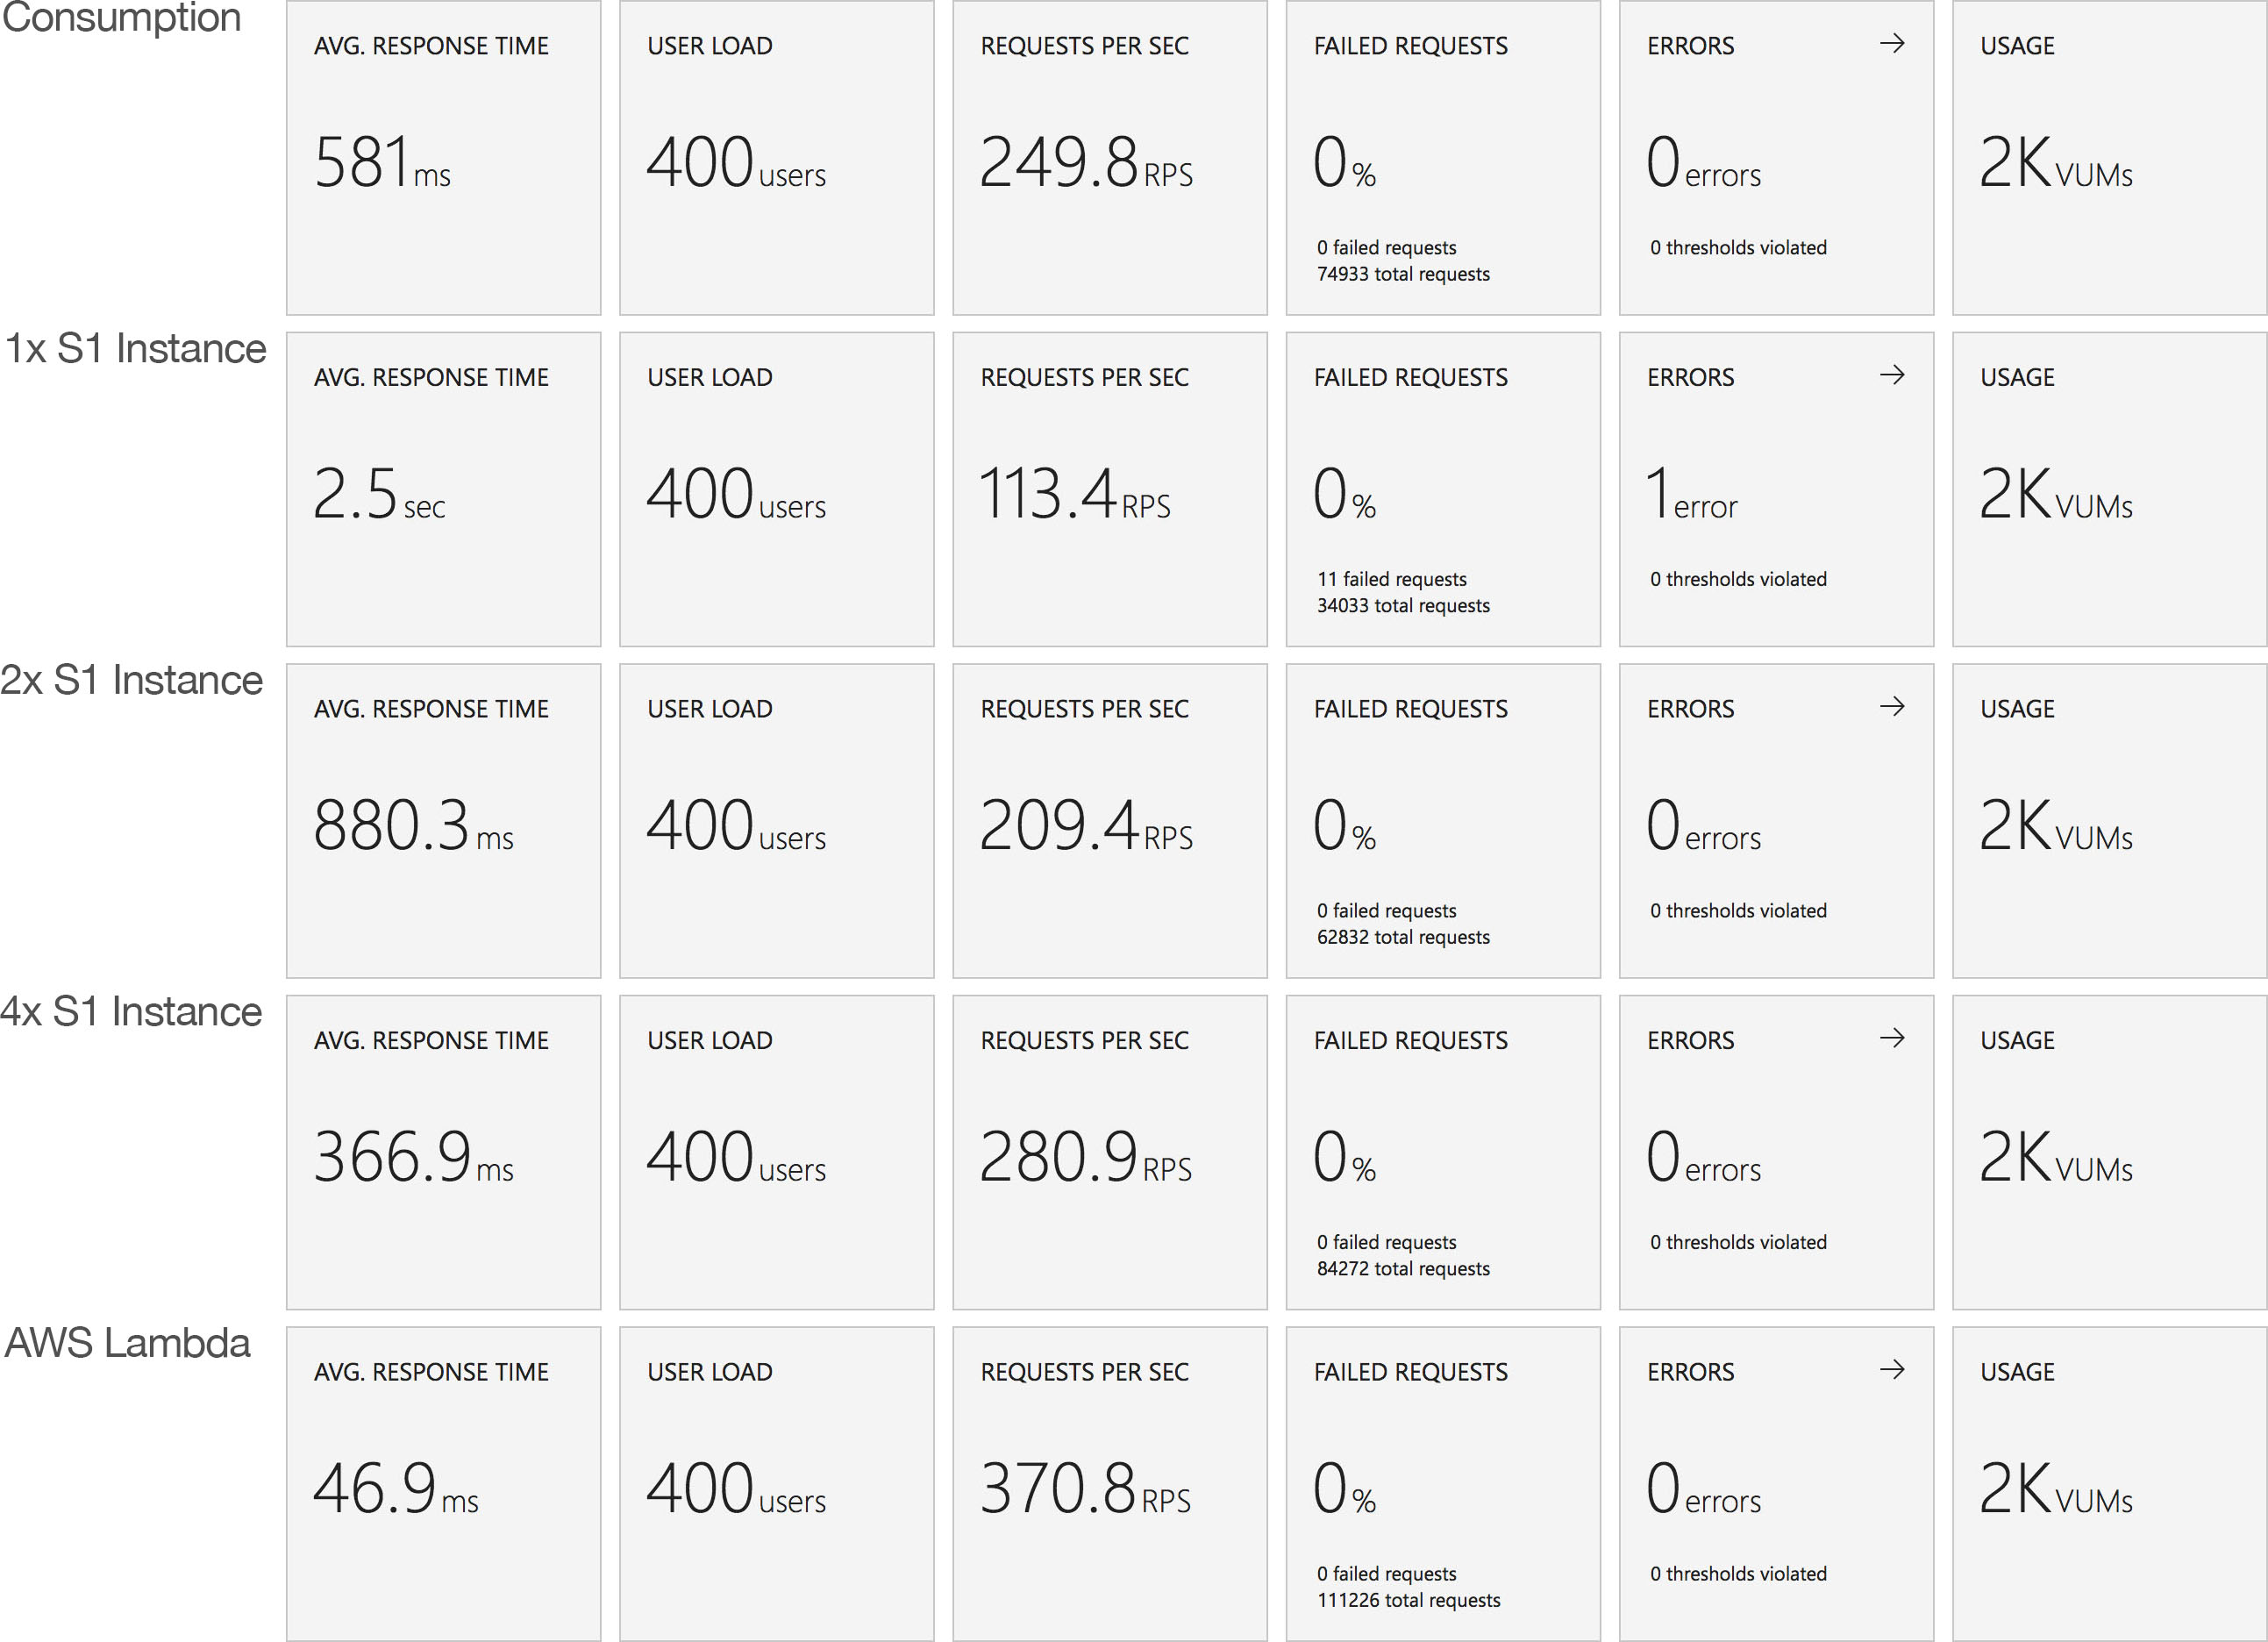
With 1000 concurrent users over 5 minutes:

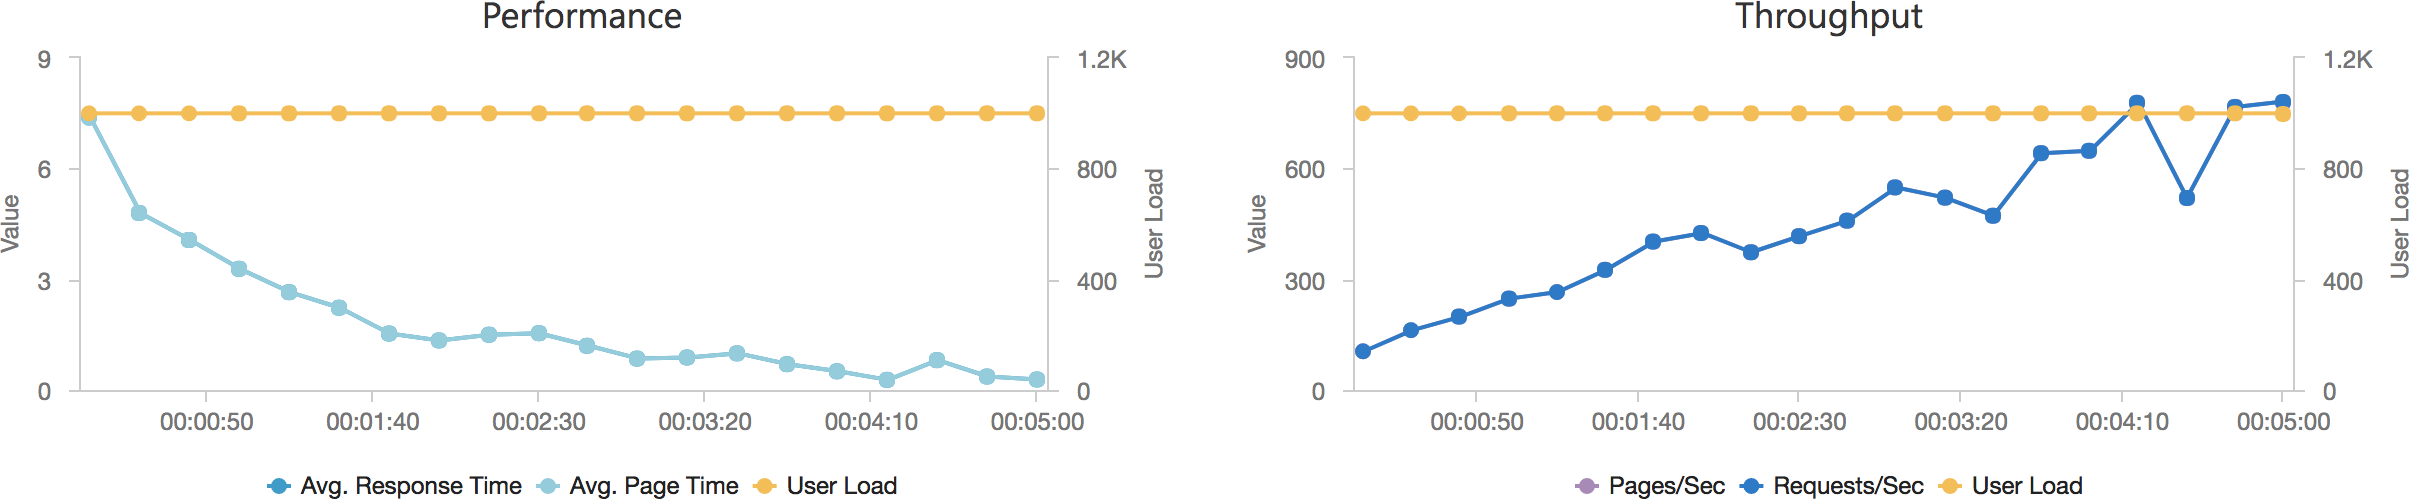
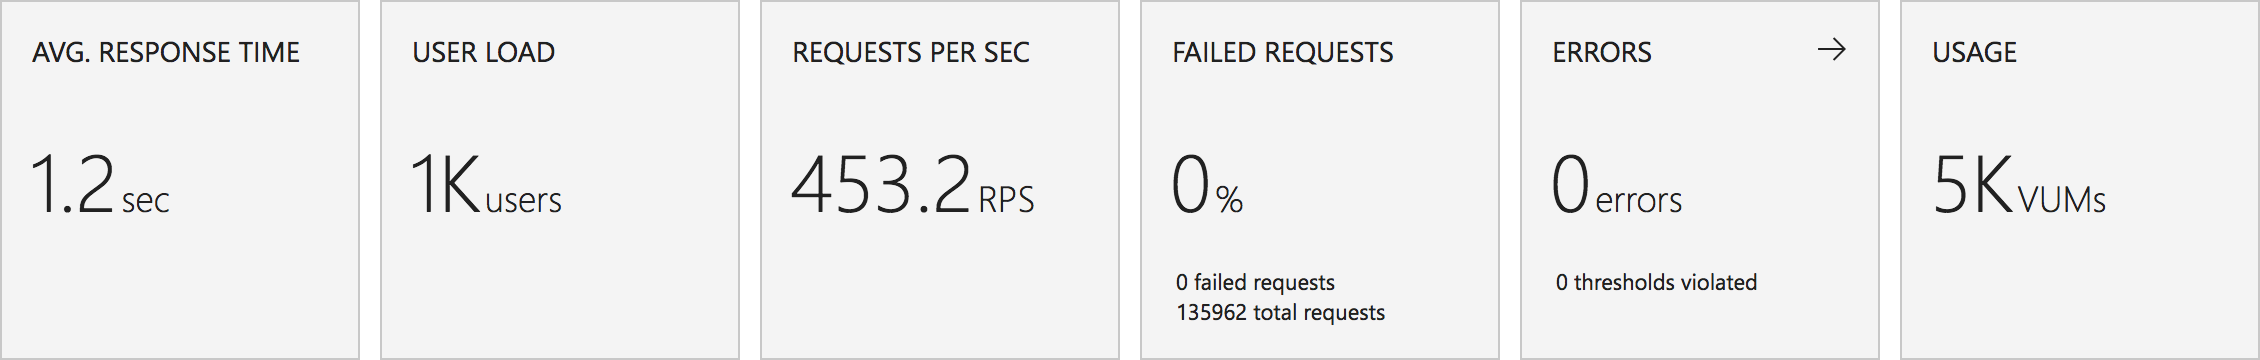
And with the add 2 users per second scenario:

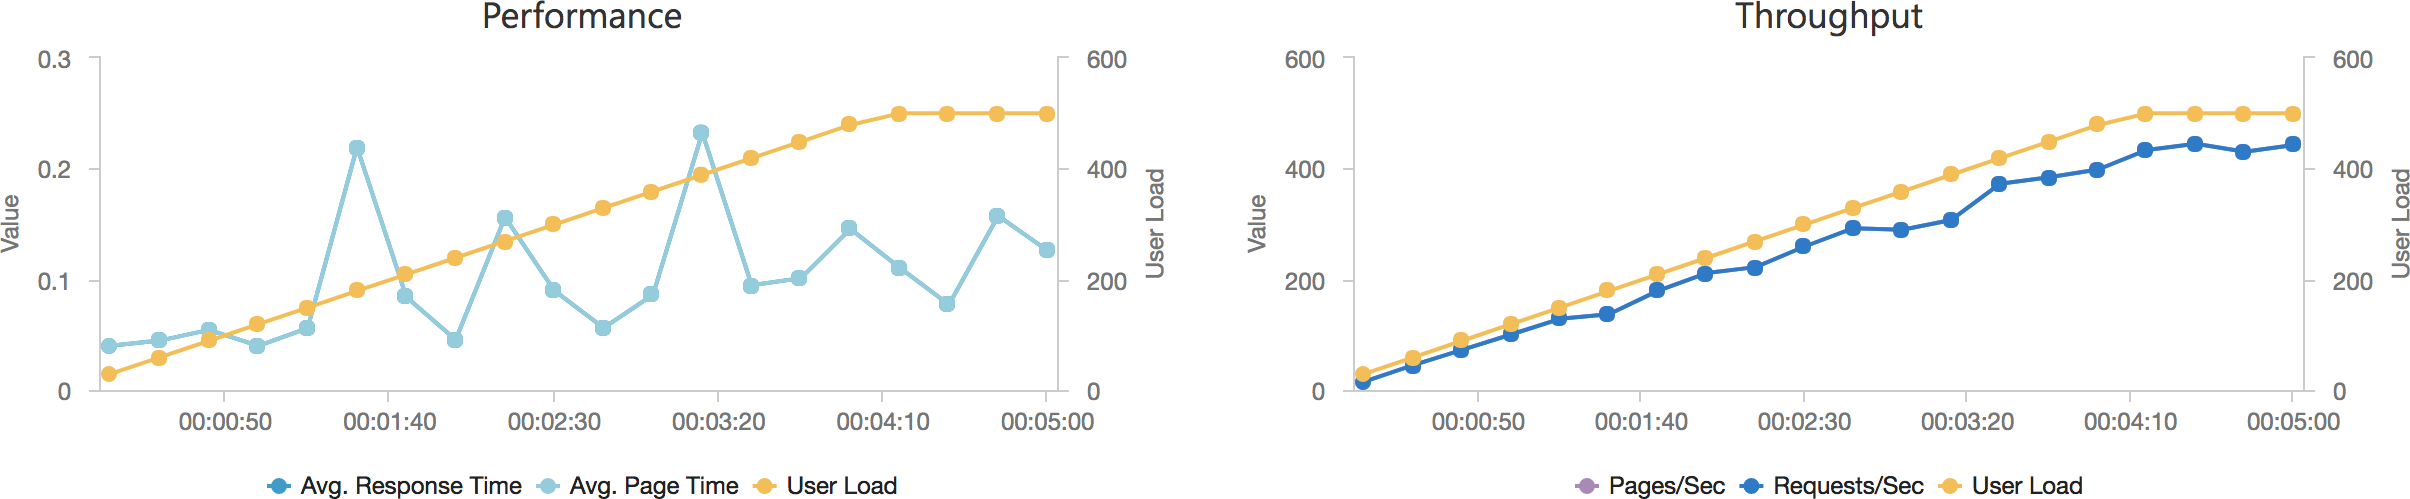
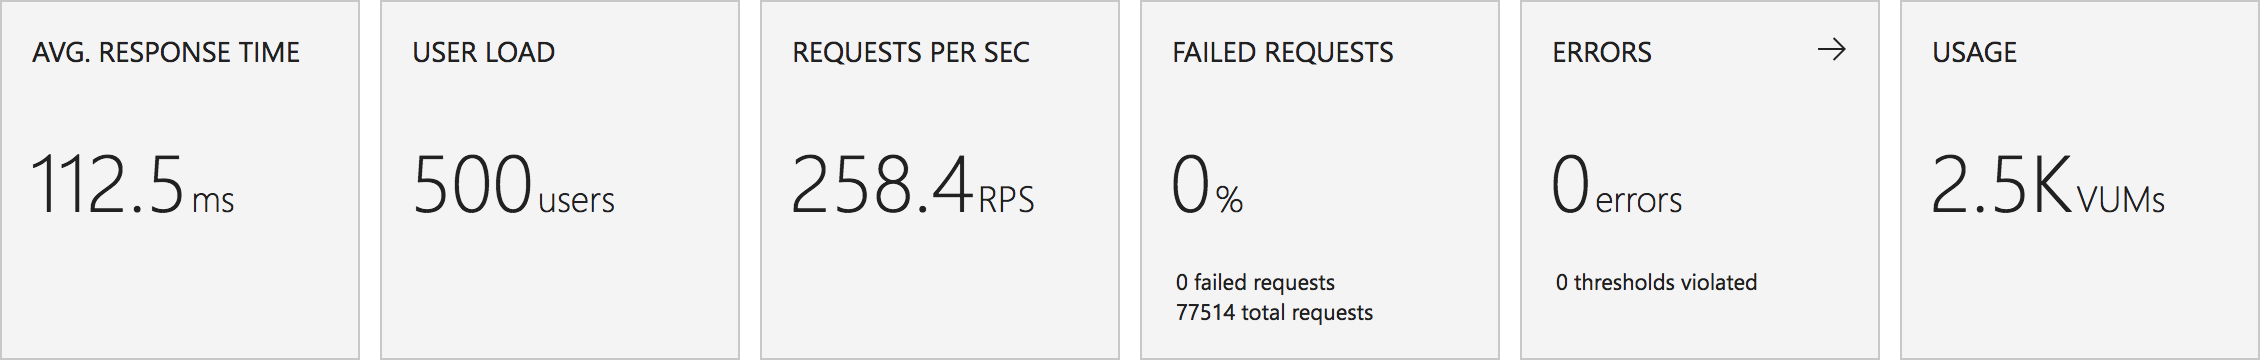
Even in this final case, and remember this Azure Function is only returning a string, we can see the response time creeping up as the user load increases and the total number of requests served is only 77514 to AWS’s 215271 over the same period with a much lower number of requests per second.

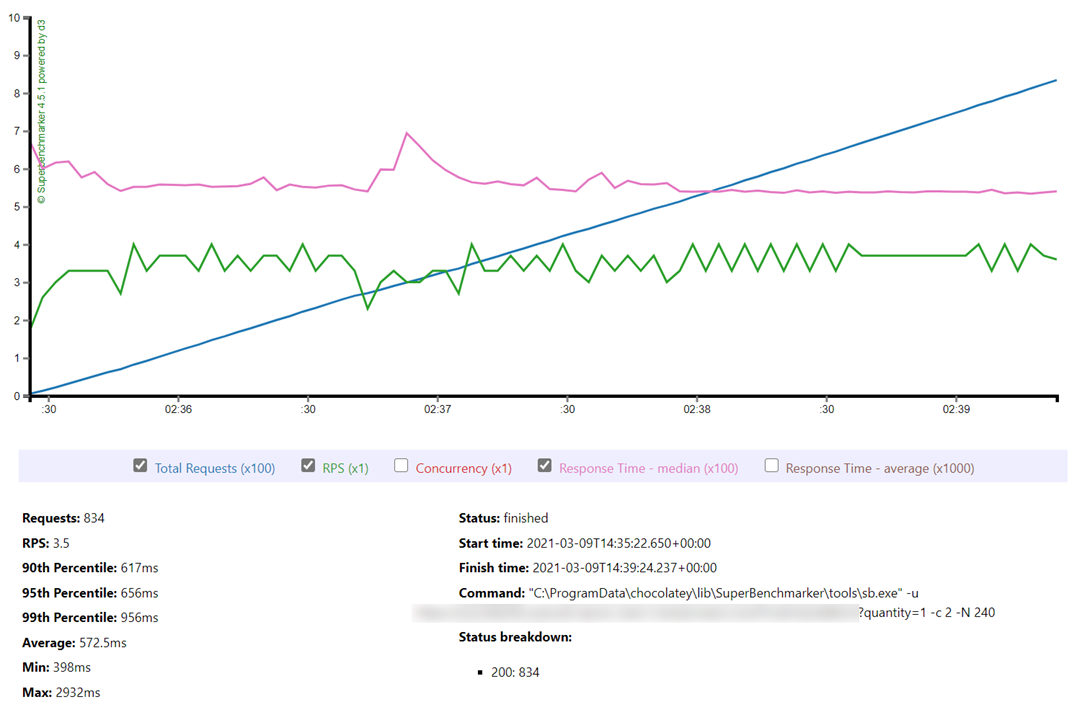
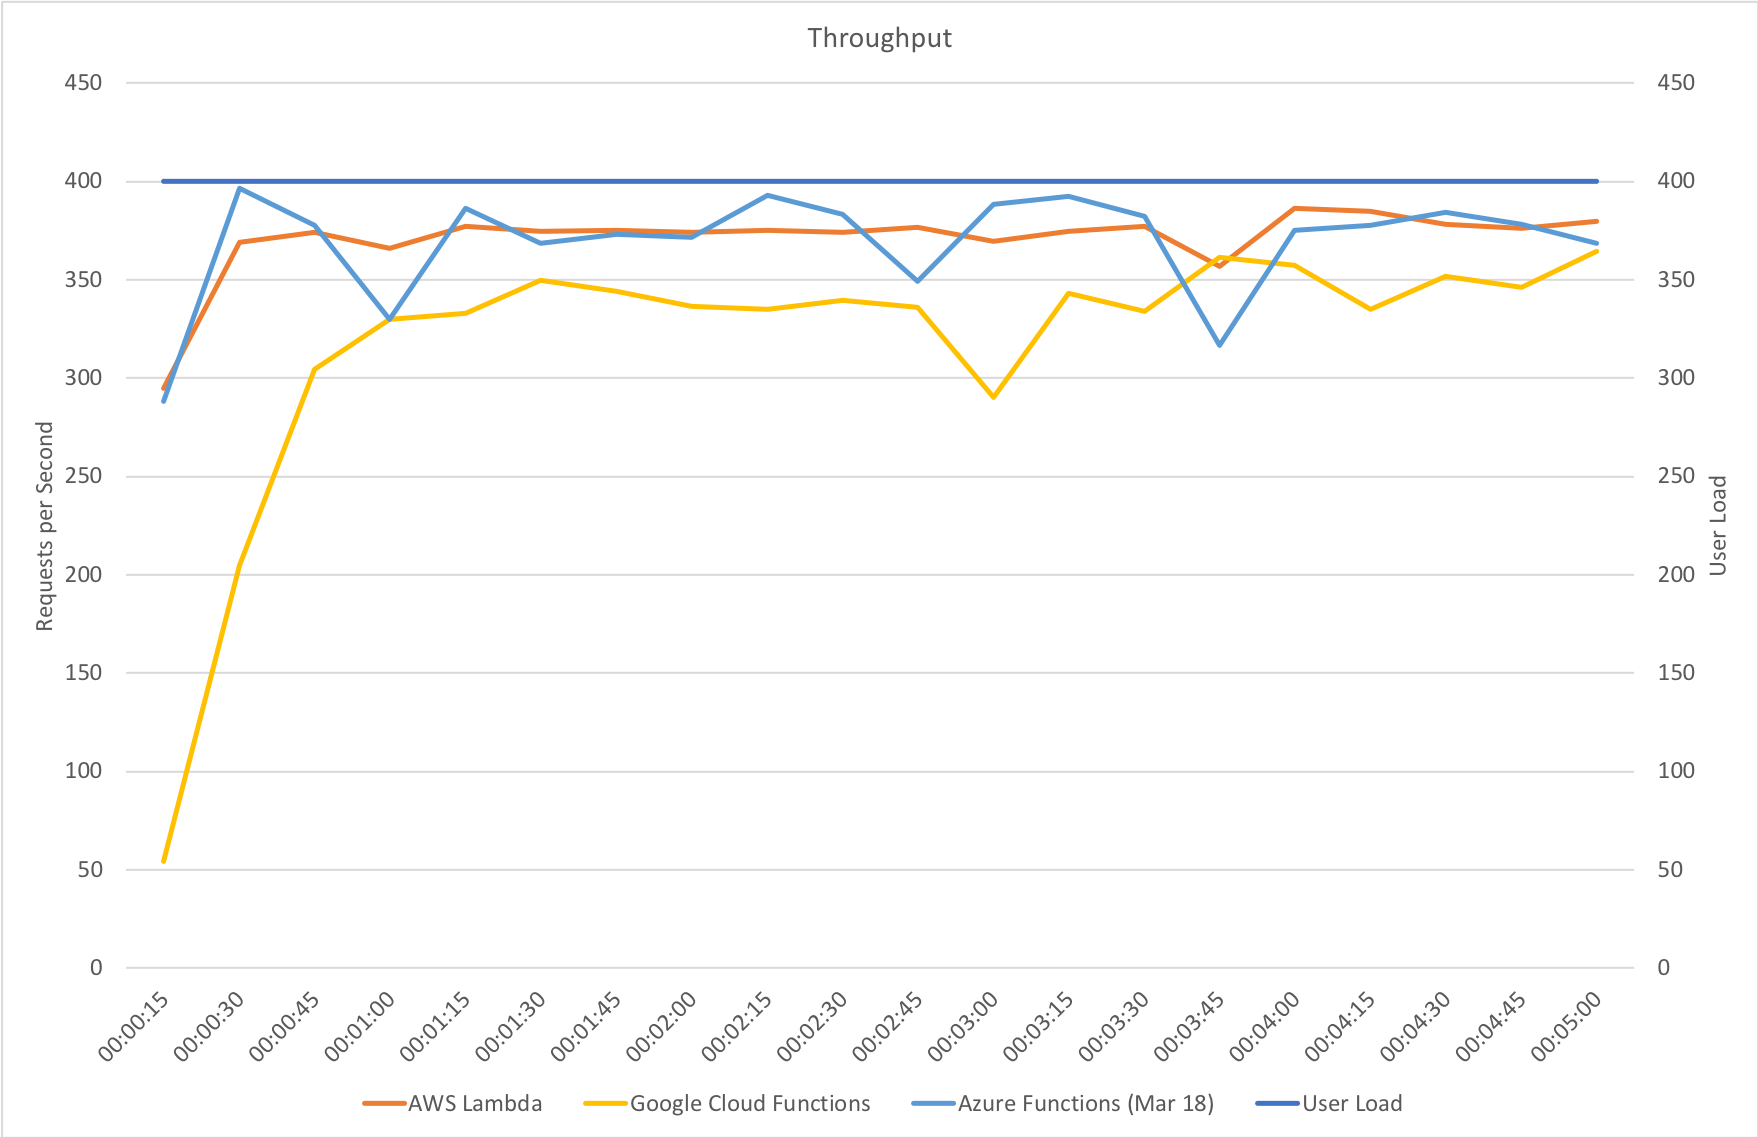
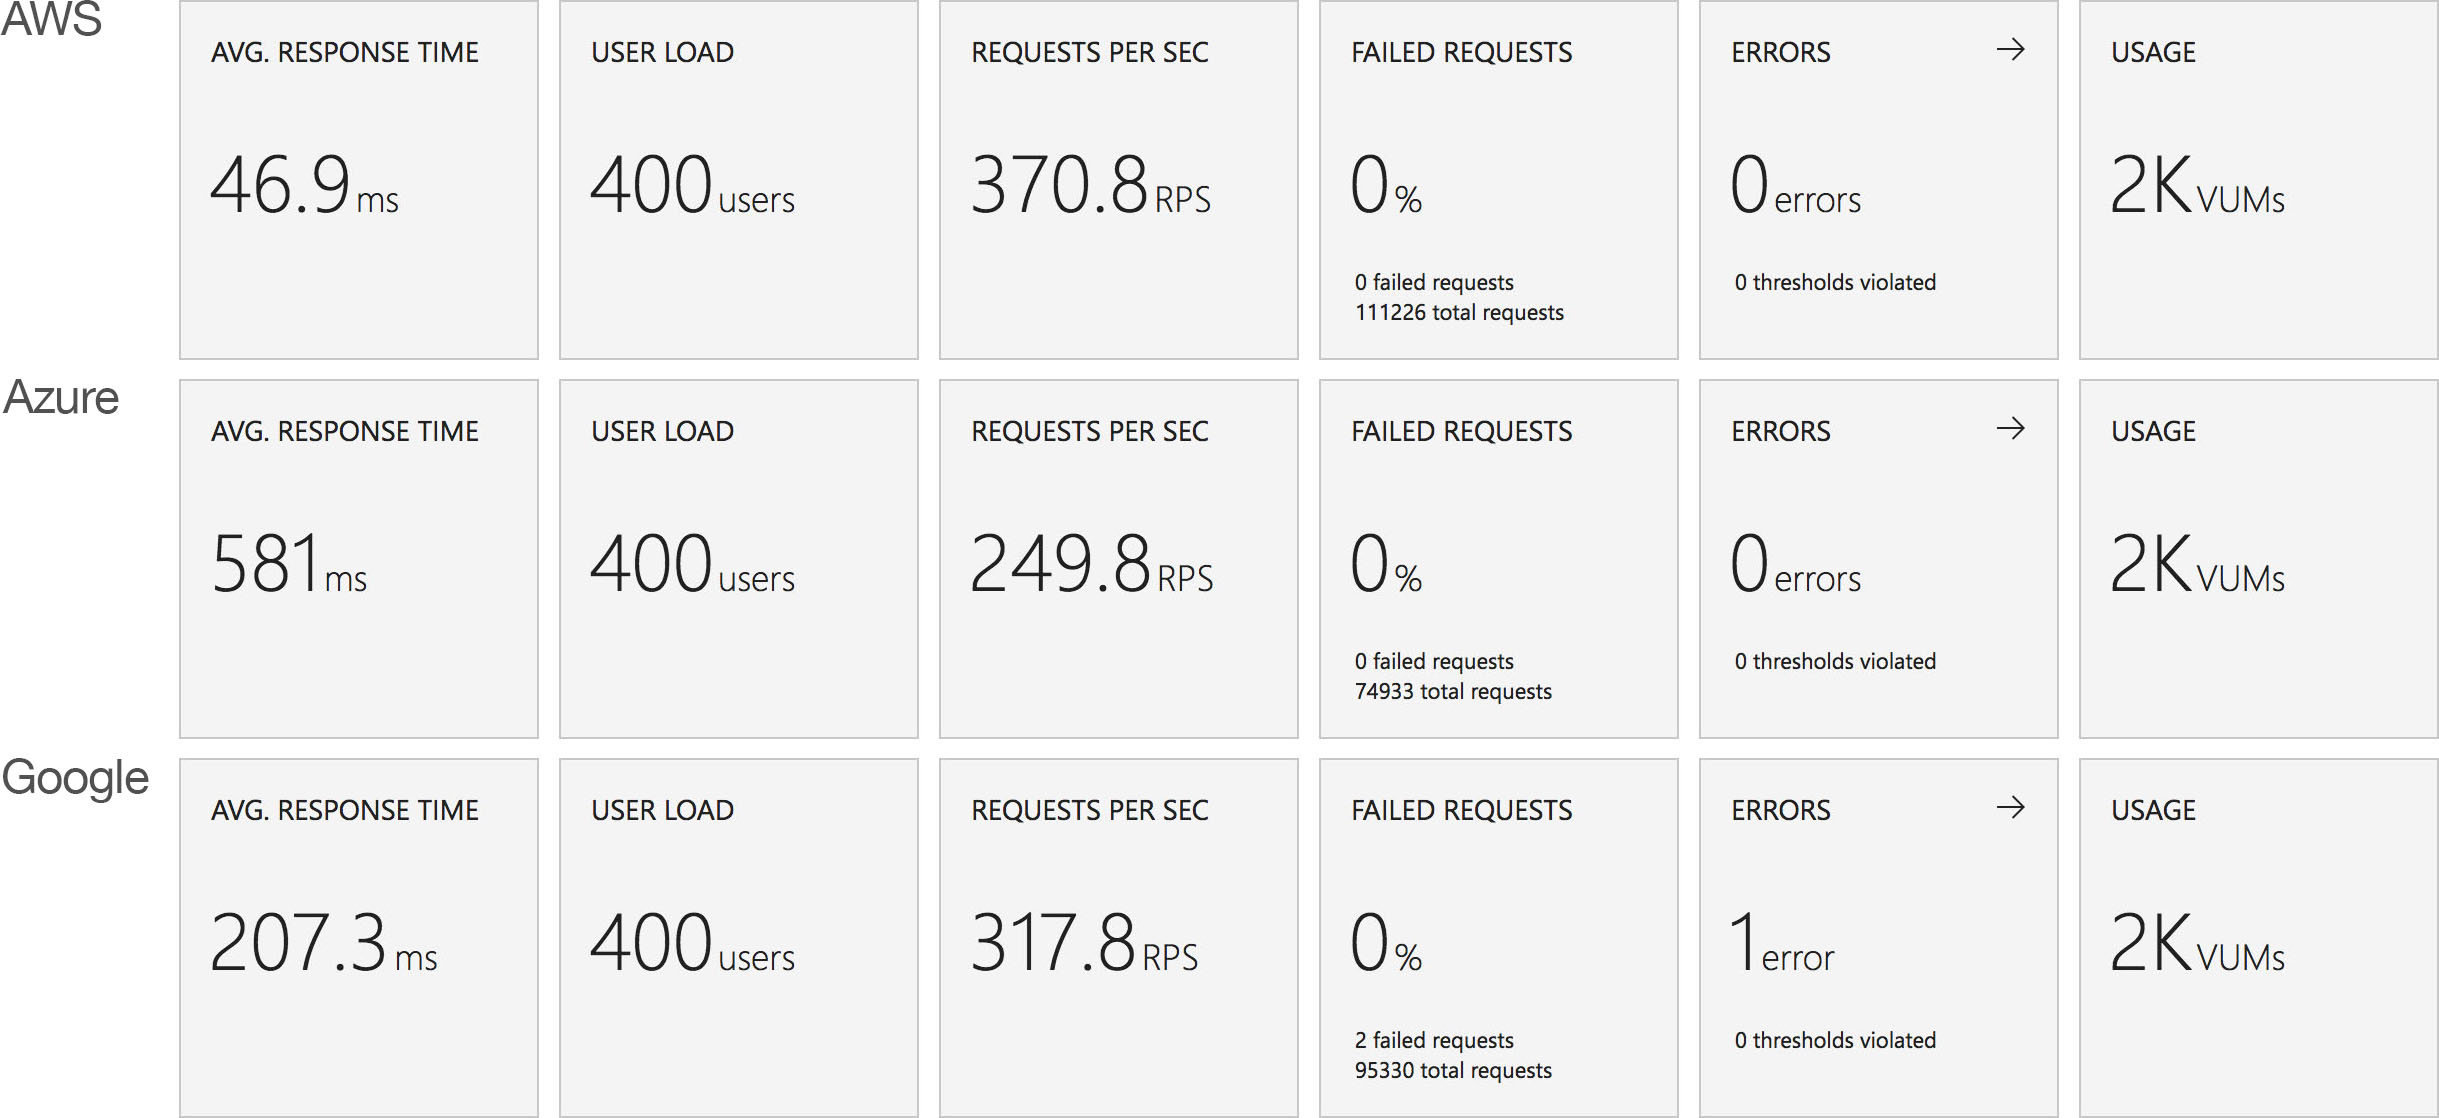
In an additional attempt to validate my conclusion that the Azure Function system is poor at scaling I pointed the AWS Lambda installation at Azure Blob Storage instead of S3. In this test other than the function entry point semantics the code running on AWS is now taking exactly the same branches as the Azure tests and using the same underlying storage mechanism, albeit with a hop across the Internet to access the storage. I ran this scenario using the 400 concurrent user scenario:

We can see from this that other than a slightly increased response time due to the storage being hosted in another data centre AWS continues to perform well and scales up almost immediately and response time remains steady and low. We can also see their is no issue with Azure Blob Storage – if there was an issue there we’d expect to see it impact these results.

With these additional validation tests (an empty workload and AWS running against Blob Storage) that pretty much isolates the issue to the Azure Function runtime.

And it’s a shame as the developer experience is great, there is solid documentation, and plenty of samples, and the development team on Twitter are ludicrously responsive – to the point that I feel bad saying what I need to say here. I will reach out to them for feedback.

Why is this the case? Well I’d suggest the root of the issue is how the system has been built on top of App Service Plans. It’s not all that, well, serverless and you still find yourself worrying about, well, servers.

On Azure an App Service Plan is essentially a collection of rented servers / reserved compute power of a given spec (CPU, memory) and capabilities. Microsoft have layered what they call a Consumption Plan over this for Azure Functions which provides for automatic scaling and consumption based pricing. Unfortunately if you track what is going on your Functions are running on a limited number of these servers which you can evidence by tracking the instance ID and by sharing state between your functions (to be clear: this is not good!).

Essentially the level of granularity for scaling your functions remains, as in a traditional hosting model, at the server level and as your system scales up instances are slowly being added – but this is throttled tightly presumably to prevent Microsoft’s costs from spiralling out of control.

Now because they run on Application Service Plans you can switch hosting away from the Consumption plan onto a standard plan (which allows additional Azure features to be used) but this, to me, completely defeats the point of serverless. I’m paying for reserved compute again and managing server instance counts. I may as well not have bothered in the first place!

It’s hard to escape the feeling that Microsoft had to play catch up with AWS Lambda (it launched as a preview in late 2014 and went into general release in April 2015 whereas Azure Functions launched as a preview in March 2016 ) and built something they could market as serverless computing as quickly as they could by reusing existing compute and scaling systems on Azure.

Would I still use Azure Functions? Yes sure – in back end scenarios where latency isn’t all that important they’re a great fit. Anything that impacts user experience? No. Definitely not at this point.

It will be interesting to see if Microsoft revise the hosting model, I suspect if they do it’s some time off as currently they seem focused on the v2 runtime which isn’t a hosting change (as far as I can see) but rather giving Functions the ability to support more languages and .NET Core.

AWS Lambda

I’ll preface this by saying I am absolutely not an AWS expert so it’s harder for me to speculate about the underlying architecture of Lambda however… the numbers don’t lie: AWS manages to respond to changes in demand very quickly and, until I started to hit throttle limits (which I would need to speak to AWS Support to have lifted), is very consistent in response times.

I’ve not tried any state sharing but I would expect it to fail: it looks like Amazon have containerised at the Function level, rather than the host server, and this is what allows them to operate as you’d expect a serverless environment to. Both scaling and billing can then be at the function level.

Would I use AWS Lambda? Yes. But as most of my development work is on Azure I’m really hoping Microsoft bridge the capability gap.

Wrap Up and Next Steps

If you’ve followed this far – thanks! I’m a big fan of the serverless model but the Azure implementation of serverless looks like something of a compromised offering at this point and I’d be cautious of recommending it without understanding in detail the usage requirements as you will quickly hit choppy water.

I am planning on repeating similar experiments with the queue processing I began some time ago and if I get any information from Microsoft around this topic will make any corrections as appropriate. This is one of those times I’d love to have got things wrong.

Contact

  • If you're looking for help with C#, .NET, Azure, Architecture, or would simply value an independent opinion then please get in touch here or over on Twitter.

Recent Posts

Recent Tweets

Invalid or expired token.

Recent Comments

Archives

Categories

Meta

GiottoPress by Enrique Chavez