Category: AWS

Azure Functions Performance – Update on EP1 Results

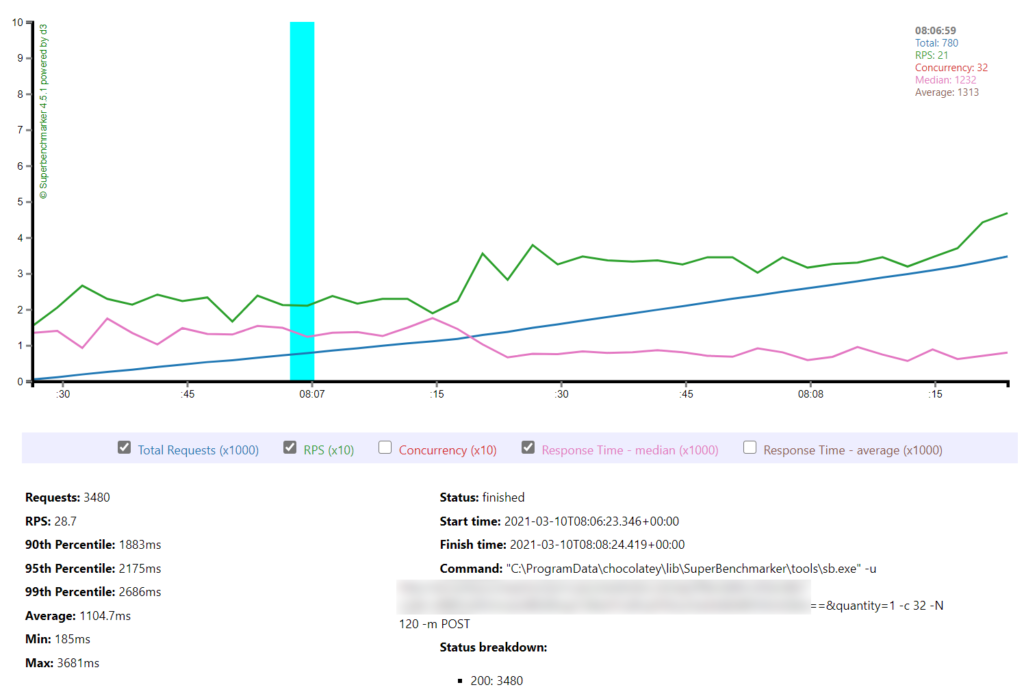
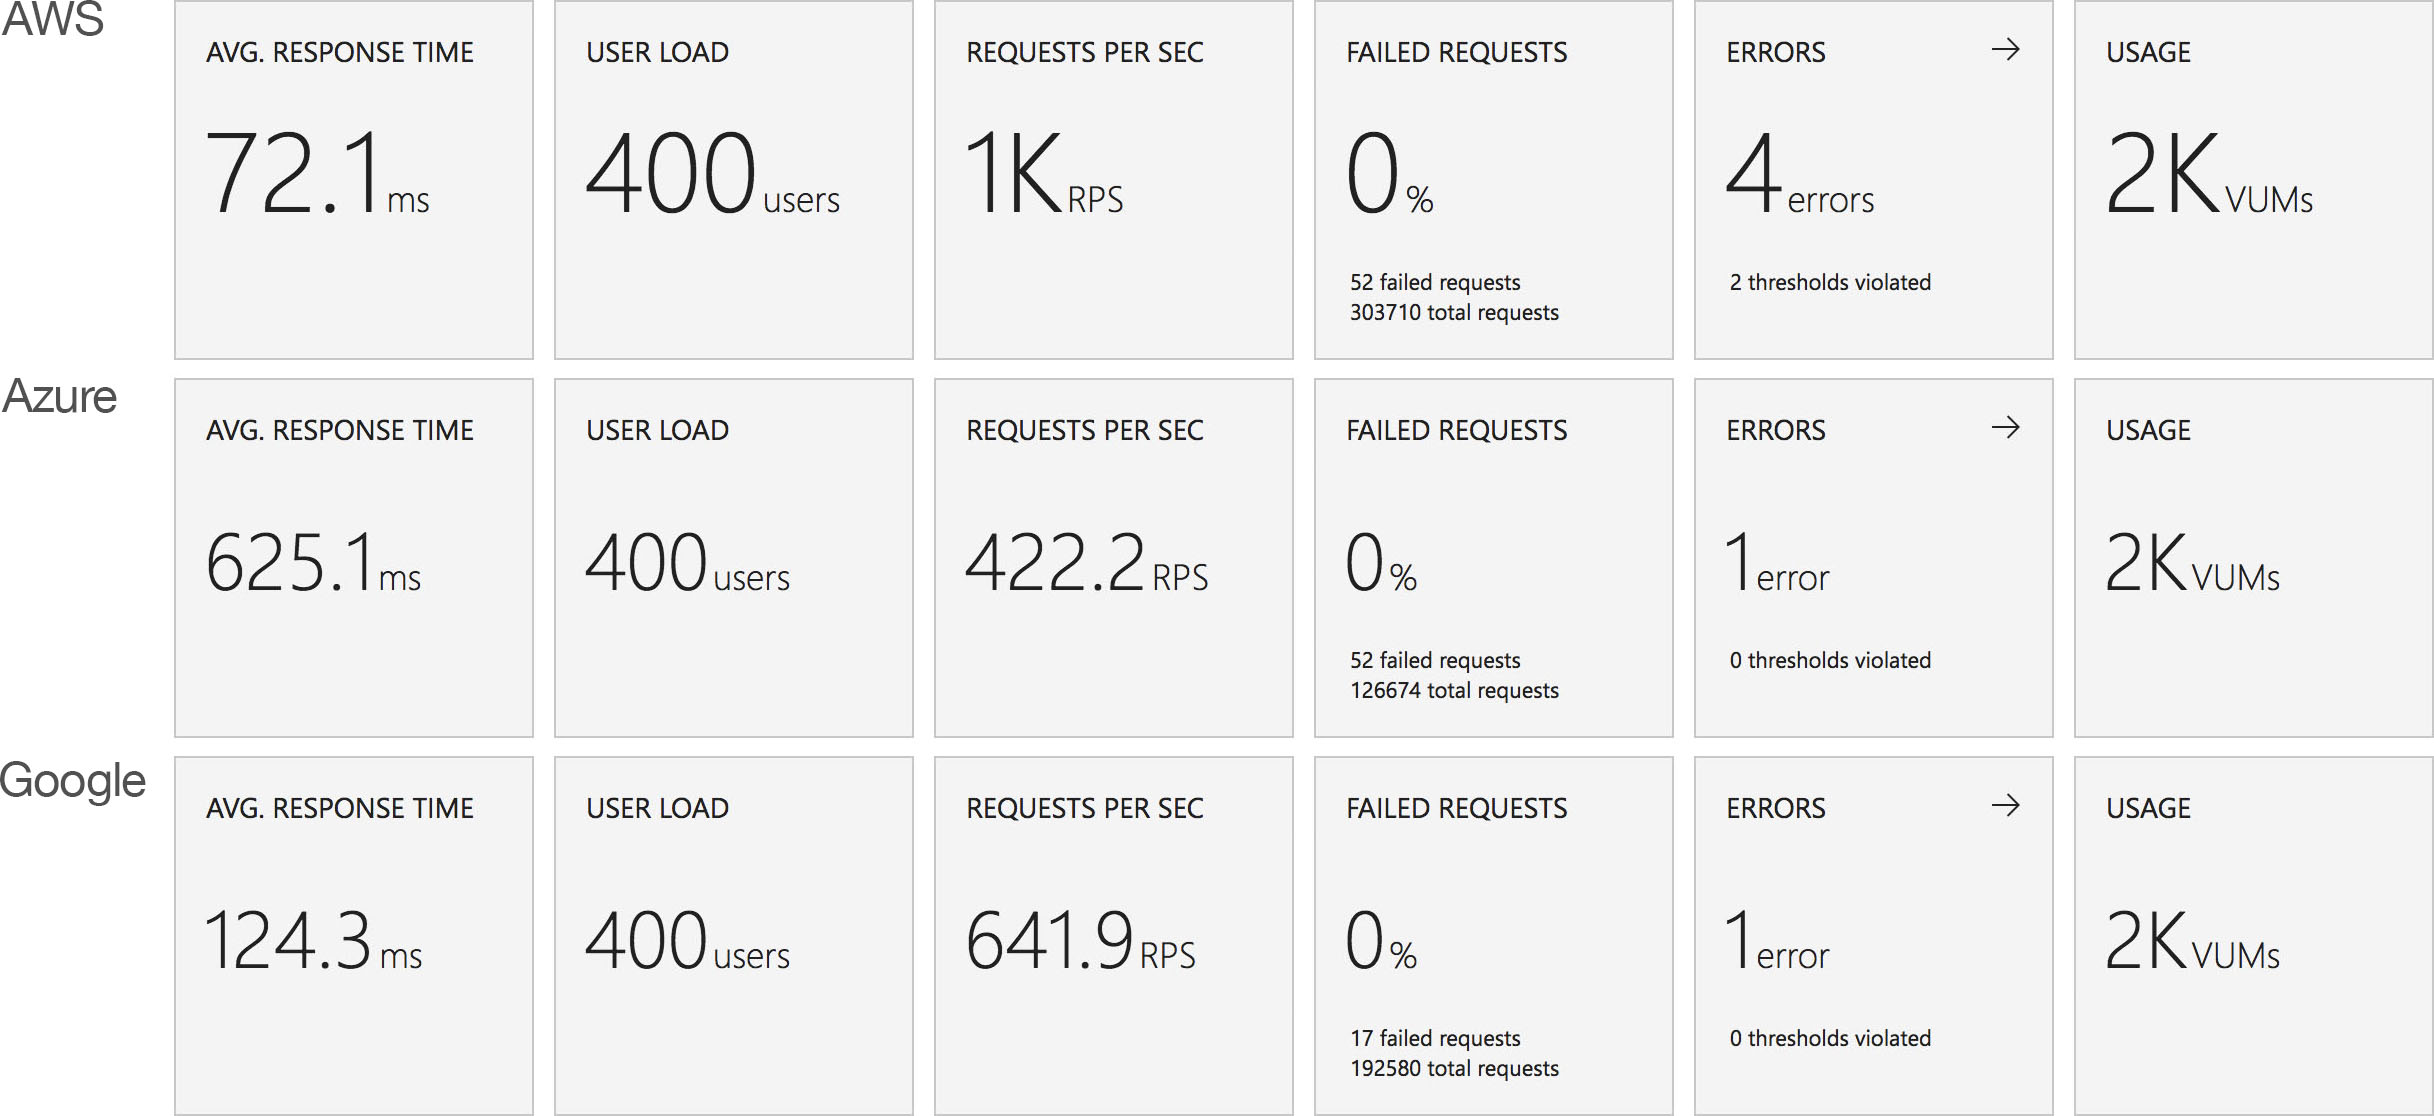
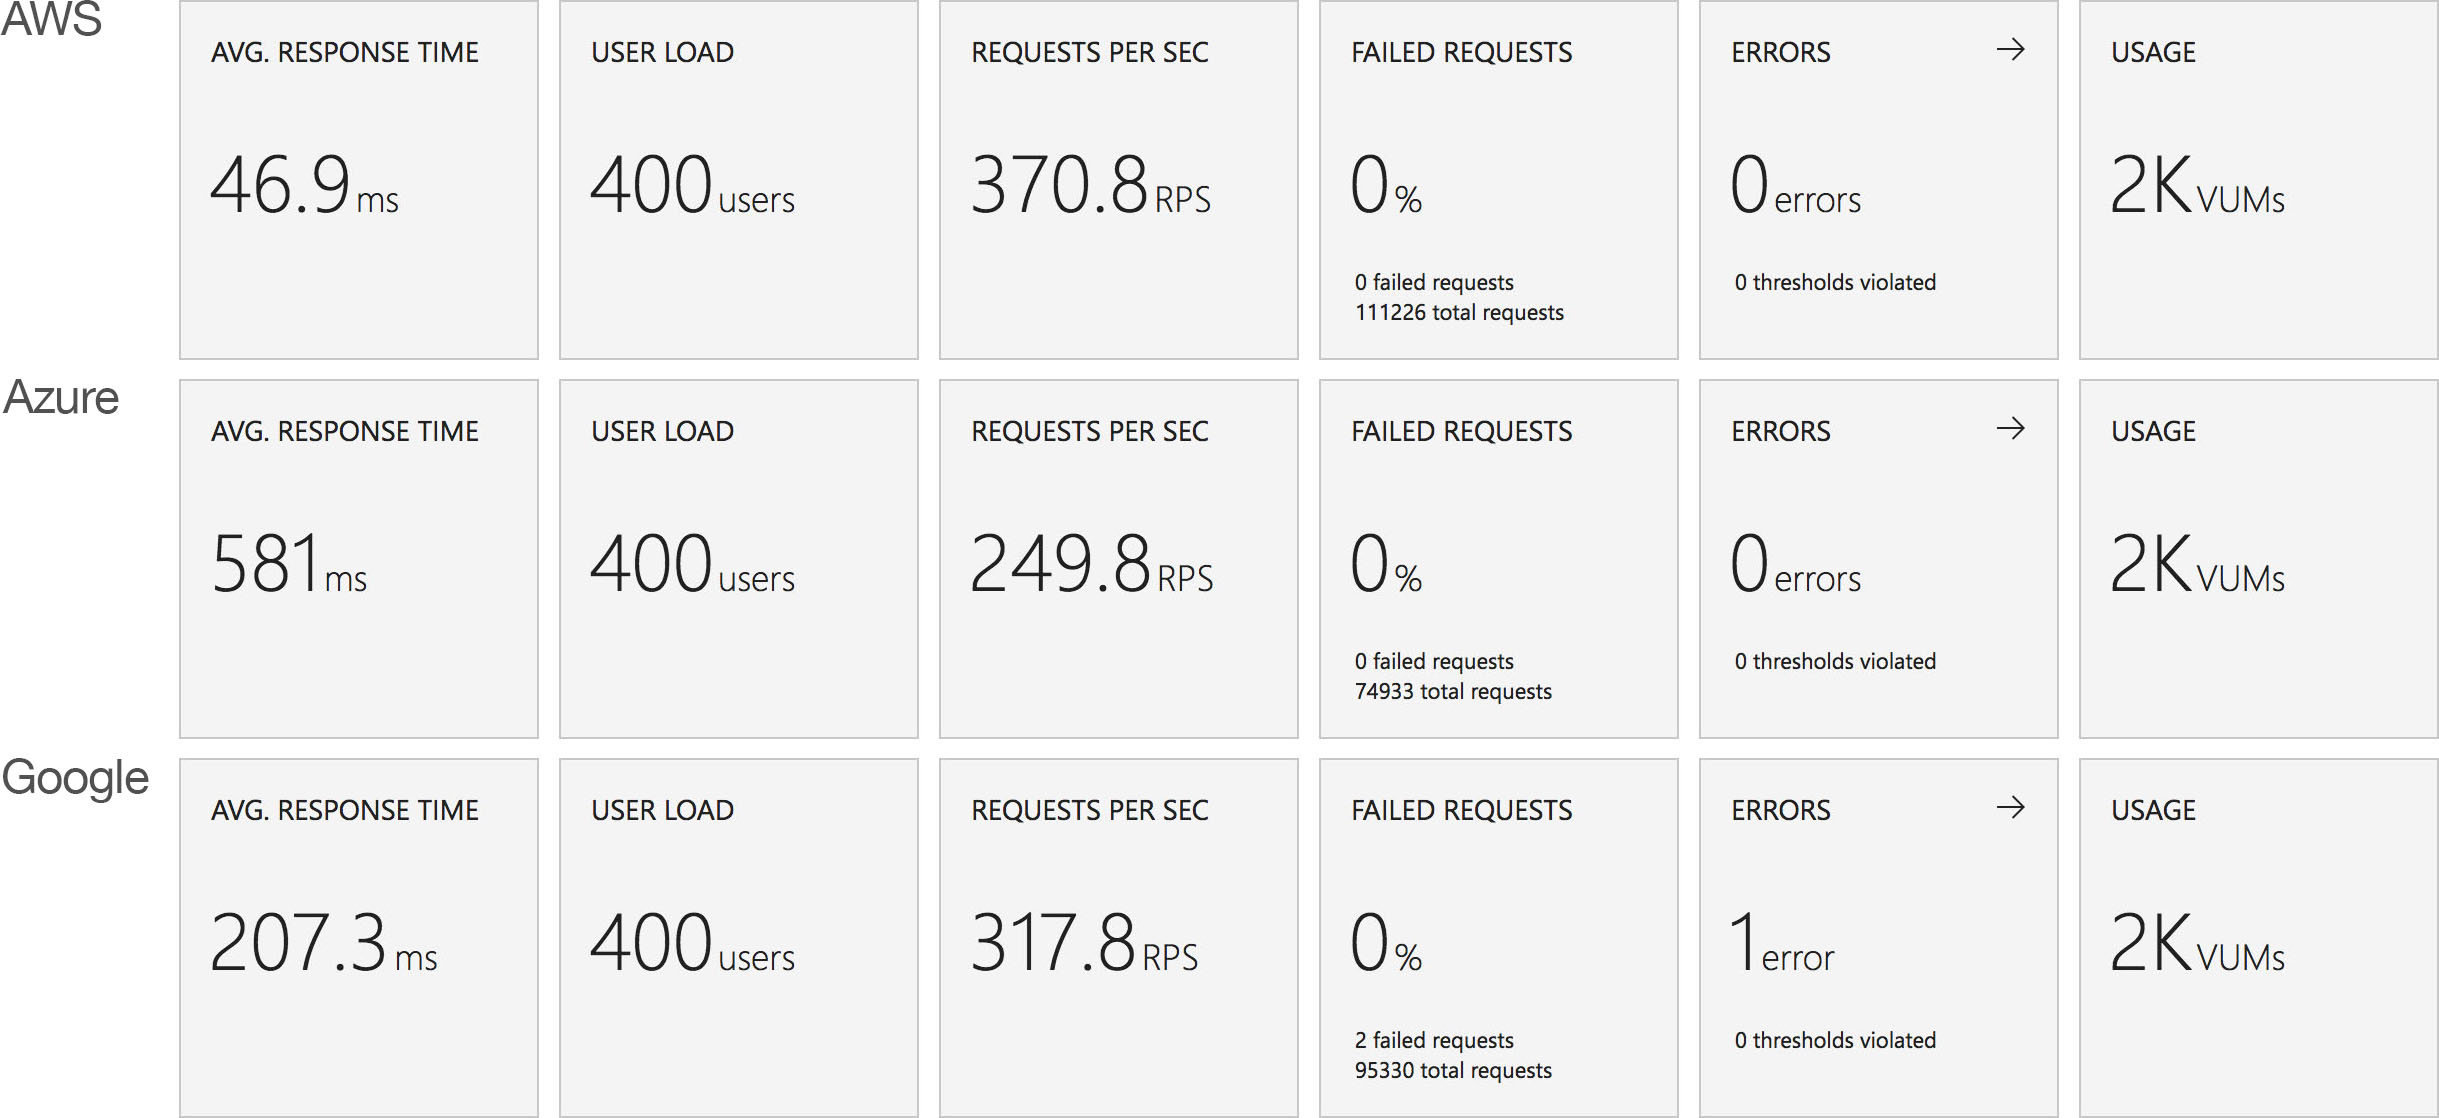
In yesterdays post comparing Azure Functions to AWS Lambda the EP1 plan was a notable poor performer – to the extent I wandered if it was an anomalous result. For context here is yesterday’s results for a low load test:

I created a new plan this morning with a view to exploring the results further and I think I can provide some additional insight into this.

You shouldn’t have to “warm” a Premium Plan but to be sure and consistent I ran these tests after allowing for an idle / scale down period and then making a single request for a Mandelbrot.

The data here is based around a test making 32 concurrent requests to the Function App for a single Mandelbrot. Here is the graph for the initial run.

First if we consider the overall statistics for the full run – they are still not great. If I pop those into the comparison chart I used yesterday EP1 is still trailing – the blue column is yesterdays EP1 result and the green line todays.

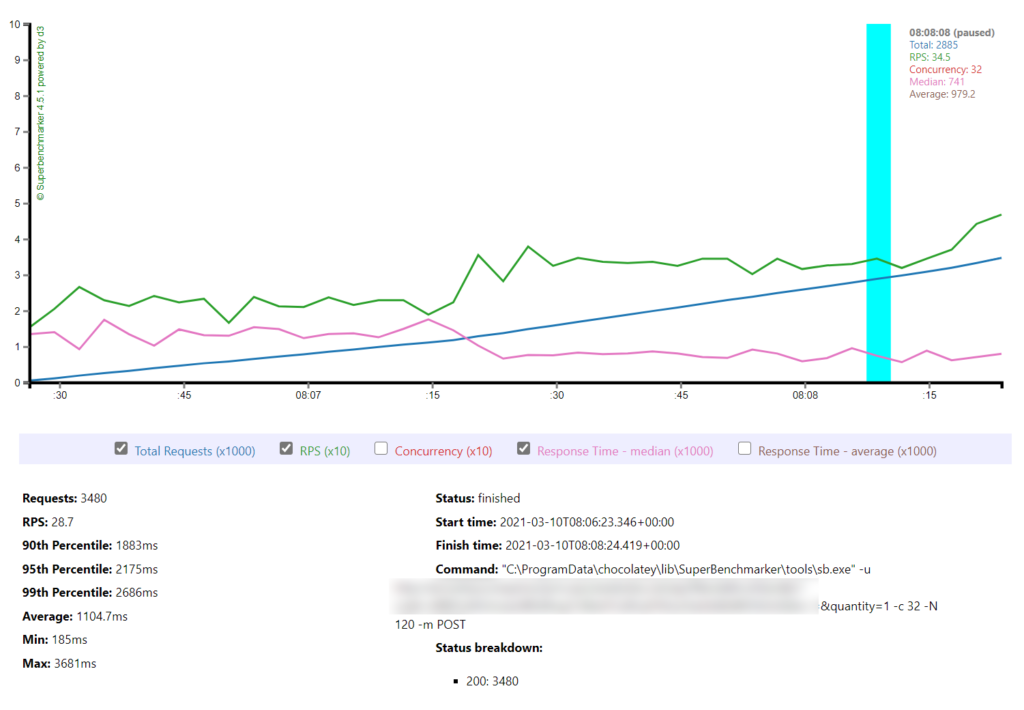
Its improved – but its still poor. However if we look at the graph of the run over time we can see its something of a graph of two halves and I’ve highlighted two sections of it (with the highlight numbers in the top half):

There is a marked increase in response time and request per second rate between the two halves. Although I’m not tracking the instance IDs I would conclude that Azure Functions scaled up to involve a second App Service Instance and that resulted in the improved throughput.

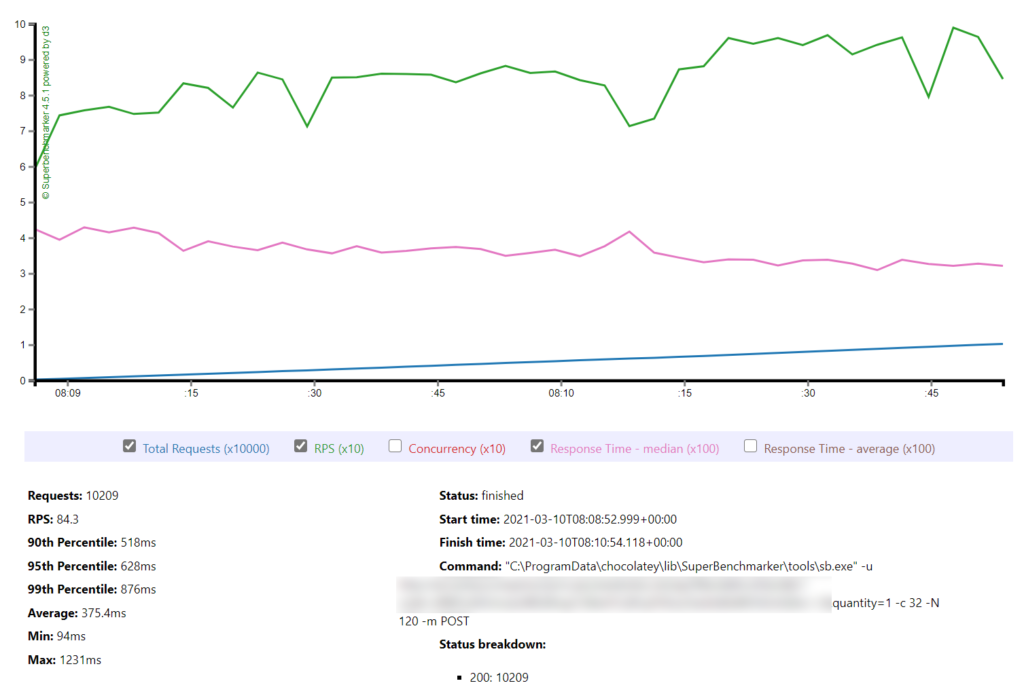
To verify this I immediately ran the test again to take advantage of the increased resource availability in the Function Plan and that result is shown below along with another comparative graph of the run in context.

We can see here that the EP1 plan is now in the same kind of ballpark as Lambda and the EP2 plan. As two EP1 instances in play we are now running with a similar amount of total compute as the EP1 plan – just on two 210 ACU instances rather than one 420 ACU instance.

To obtain this level of performance we are sacrificing consumption based billing and moving to a baseline cost of £0.17 per hour (£125 per month) bursting to £0.34 per hour (£250 per month) to cover this low level of load.

Conclusions

I would argue this verifies yesterdays results – with a freshly deployed Function App we have obtained similar results and by looking at its behavior over time we can see how Azure Functions is adding resource to an EP1 plan then giving us similar total resource to the EP2 plan and similar results.

Every workload is different and I would always encourage this but based on this I would strongly suggest that if you’re using Premium Plan’s you dive into your workload and seek to understand if it is a cost effective use of your spend.

Migrating www.forcyclistsbycyclists.com to AWS from Azure (Part 1)

If you follow me on Twitter you might have seen that as a side project I run a cycling performance analytics website called Performance For Cyclists – this is currently running on Azure.

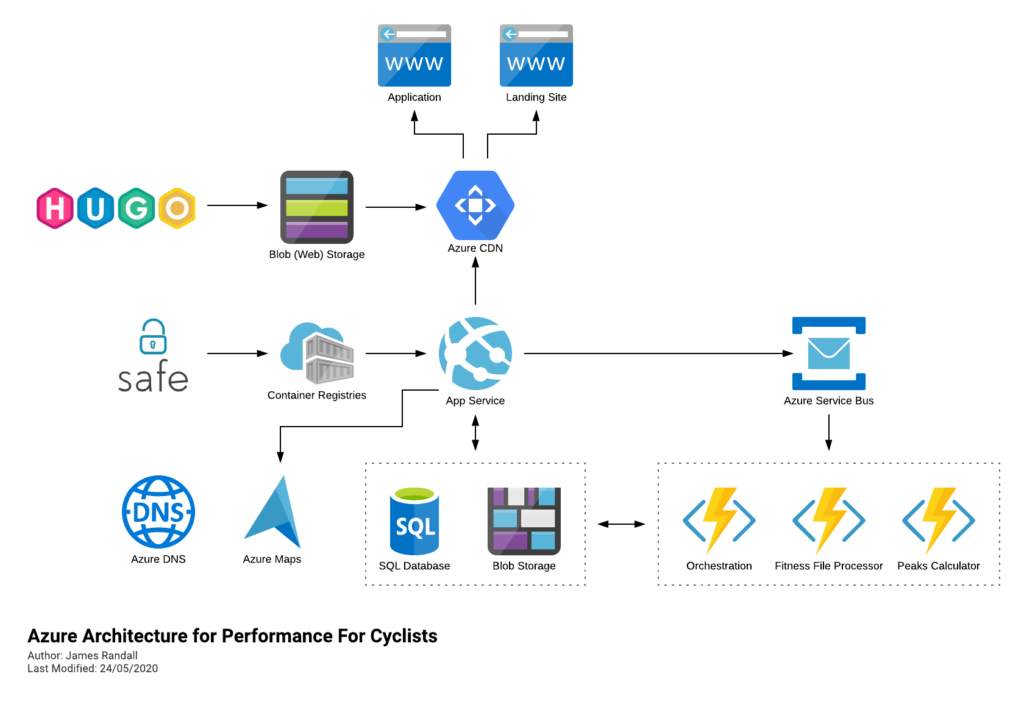
Its built in F# and deploys to Azure largely like this (its moved on a little since I drew this but not massively):

It runs fine but if you’ve been following me recently you’ll know I’ve been looking at AWS and am becoming somewhat concerned that Microsoft are falling behind in a couple of key areas:

  • Support for .NET – AWS seem to always be a step ahead in terms of .NET running in serverless environments with official support for the latest runtimes rolling out quickly and the ability to deploy custom runtimes if you need. Cold starts are much better and they have the capability to run an ASP.Net Core application serverlessly with much less fuss.

    I can also, already, run .NET on ARM on AWS which leads me to my second point (its almost as if I planned this)…
  • Lower compute costs – my recent tests demonstrated that I could achieve a 20% to 40% saving depending on the workload by making use of ARM on AWS. It seems clear that AWS are going to broaden out ARM yet further and I can imagine them using that to put some distance between Azure and AWS pricing.

    I’ve poked around this as best I can with the channels available to me but can’t get any engagement so my current assumption is Microsoft aren’t listening (to me or more broadly), know but have no response, or know but aren’t yet ready to reveal a response.

(just want to be clear about something – I don’t have an intrinsic interest in ARM, its the outcomes and any coupled economic opportunities that I am interested in)

I’m also just plain and simpe curious. I’ve dabbled with AWS, mostly when clients were using it when I freelanced, but never really gone at it with anything of significant size.

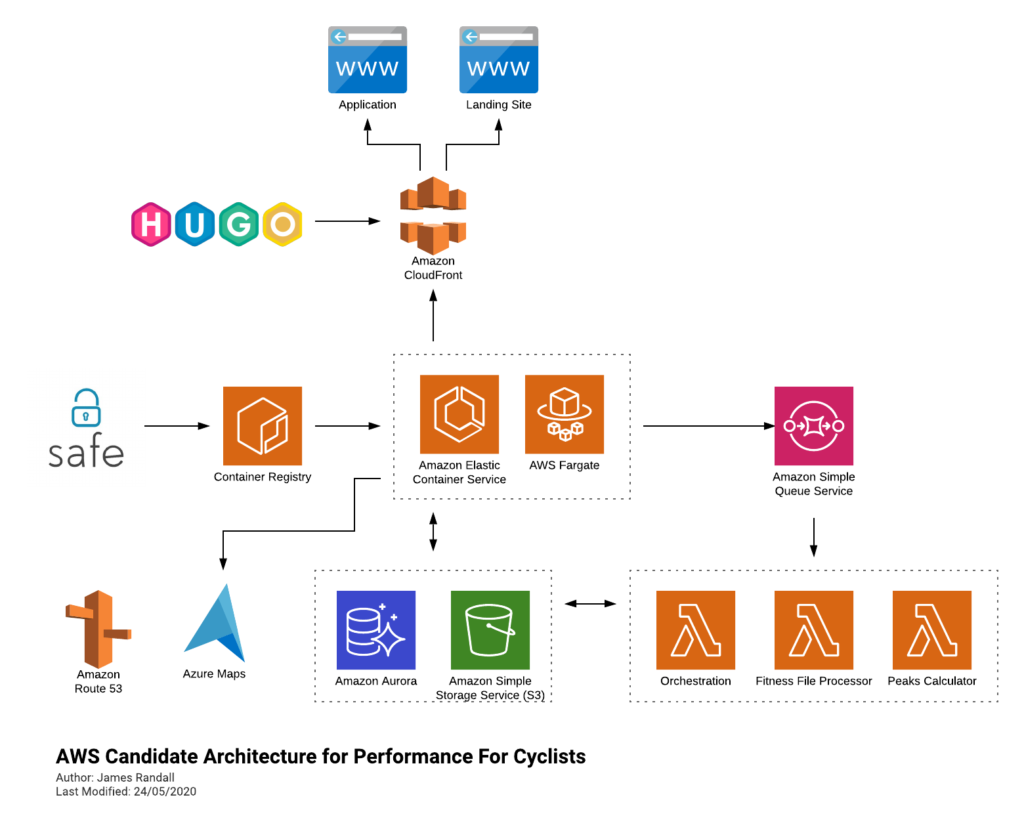
I’m going to have to figure my way through things a bit, and doubtless iterate, but at the moment I’m figuring its going to end up looking something like this:

Leaving Azure Maps their isn’t a mistake – I’m not sure what service on AWS offers the functionality I need, happy to here suggestions on Twitter!

I may go through this process and decide I’m going to stick with Azure but worst case is that I learn something! Either way I’ll blog about what I learn. I’ve already got the API up and running in ECS backed by Fargate and being built and deployed through GitHub Actions and so I’ll write about that in my next post.

Compute “Bang for Buck” on Azure and AWS – 20% to 40% advantage on AWS

As I normally post from a developer perspective I thought it might be worth starting off with some additional context for this post. If you follow me on Twitter you might know that about 14 months ago I moved into a CTO role at a rapidly growing business – we’re making ever increasing use of the cloud both by migrating workloads and the introduction of new workloads. Operational cost is a significant factor in my budget. To me the cloud can be summarised as “cloud = economics + capabilities” and so if I have a similar set of capabilities (or at least capabilities that map to my needs) then reduction in compute costs has the potential to drive the choice of vendor and unlock budget I can use to grow faster.

In the last few posts I’ve been exploring the performance of ARM processors in the cloud but ultimately what matters to me is not a processor architecture but the economics it brings – how much am I paying for a given level of performance and set of characteristics.

It struck me there were some interesting differences across ARM, x86, Azure and AWS and I’ve expanded my testing and attempted here to present these findings in (hopefully) useful terms.

All tests have been run on CentOS Linux (or the AWS derivative) using the .NET 5 runtime with Apache acting as a reverse proxy to Kestrel. I’ve followed the same setup process on every VM and then run performance tests directly against their public IP using loader.io all within the USA.

I’ve run two workloads:

  1. Generate a Mandelbrot – this is computationally heavy with no asynchronous yield points.
  2. A test that simulates handing off asynchronously to remote resources. I’ve included a small degree of randomness in this.

At the bottom of the post is a table containing the full set of tests I’ve run on the many different VM types available. I’m going to focus on some of the more interesting scenarios here.

Computational Workload

2 Core Tests

For these tests I picked what on AWS is a mid range machine and on Azure the entry level D series machine:

AWS (ARM): t4g.large – a 2 core VM with 8GiB of RAM and costing $0.06720 per hour
AWS (x86): t3.large – a 2 core VM with 8GiB of RAM and costing $0.08320 per hour
Azure (x86): D2s v4 – a 2 core VM with 8GiB of RAM and costing $0.11100 per hour

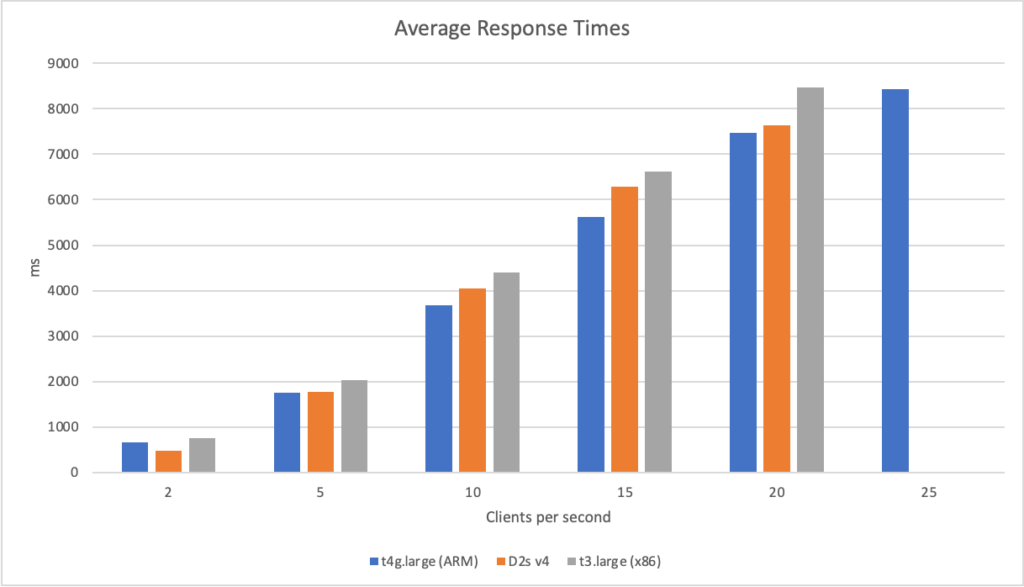
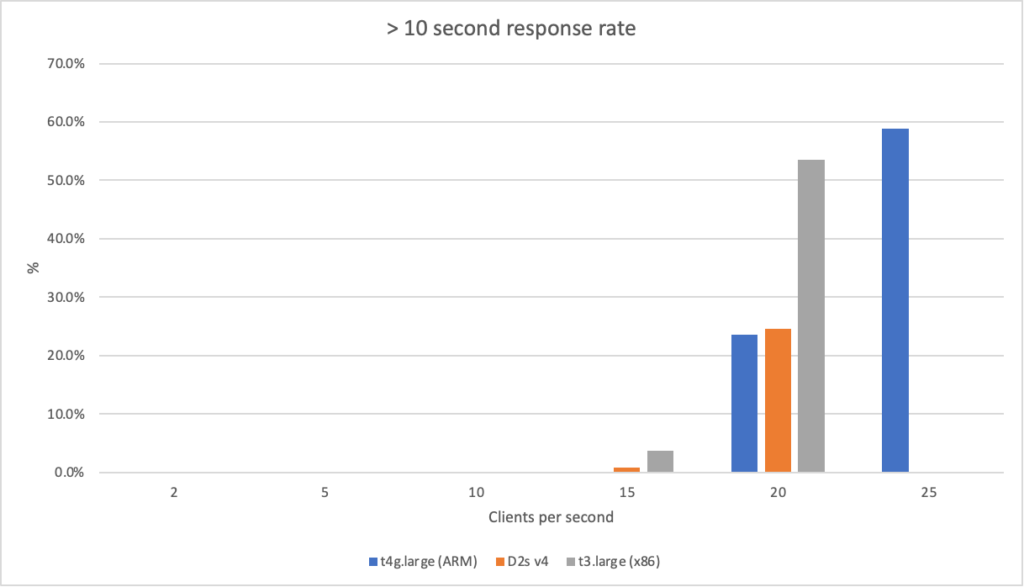
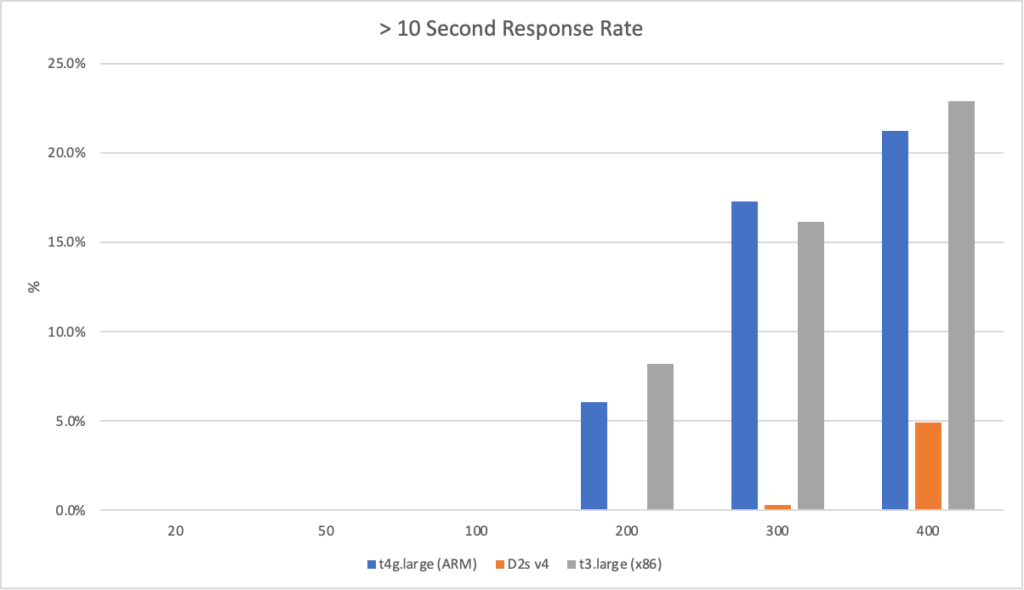
On these machines I then ran the workloads with different numbers of clients per seconds and measured their response times and the failure rate (failure being categorised as a response of > 10 seconds):

Both Intel VMs generated too many errors at the 25 client per second rate and the load tester aborted.

Its clear from these results that the ARM VM running on AWS has a significant bang for buck advantage – its more performant than the Intel machines and is 20% cheaper than the AWS Intel machine and 40% cheaper than the Azure machine.

Interestingly the Intel machine on AWS lags behind the Intel machine on Azure particularly when stressed. It is however around 20% cheaper and it feels as if performance between the Intel machines is largely on the same economic path (the AWS machine is slightly ahead if you normalise the numbers).

4 Core Tests

I wanted to understand what a greater number of cores would do for performance – in theory it should let me scale past the 20 client per second level of the smaller instances. Having concluded that ARM represented the best value for money for this workload on AWS I didn’t do an x86 test on AWS. I used:

AWS: t4g.xlarge (ARM) – a 4 core VM with 16GiB of RAM and costing $0.13440 per hour
Azure: D4s_v4 – a 4 core VM with 16GiB of RAM and costing $0.22200 per hour

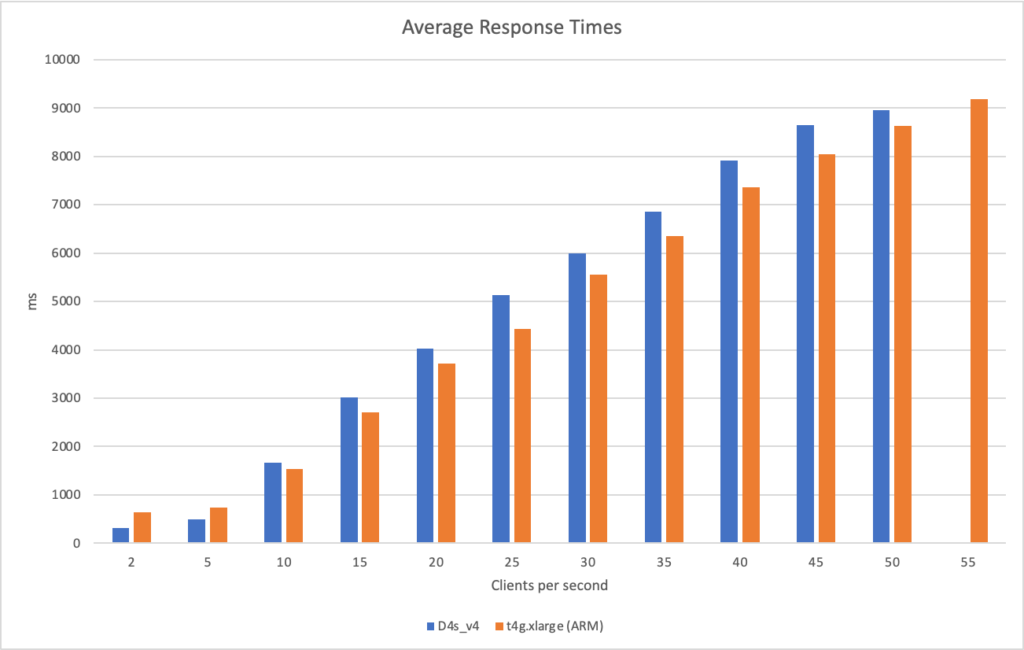
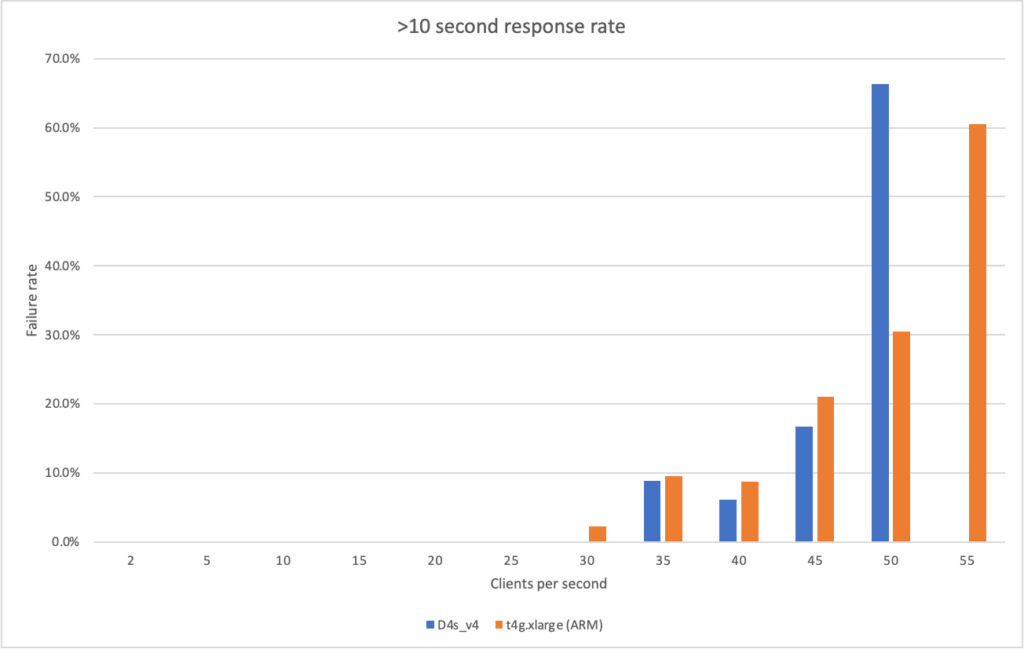
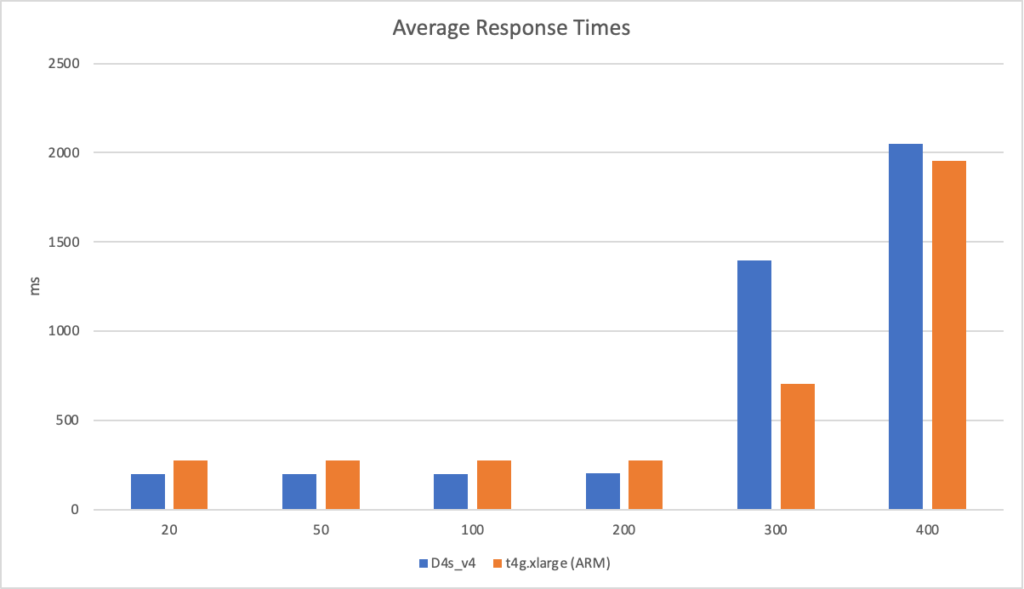
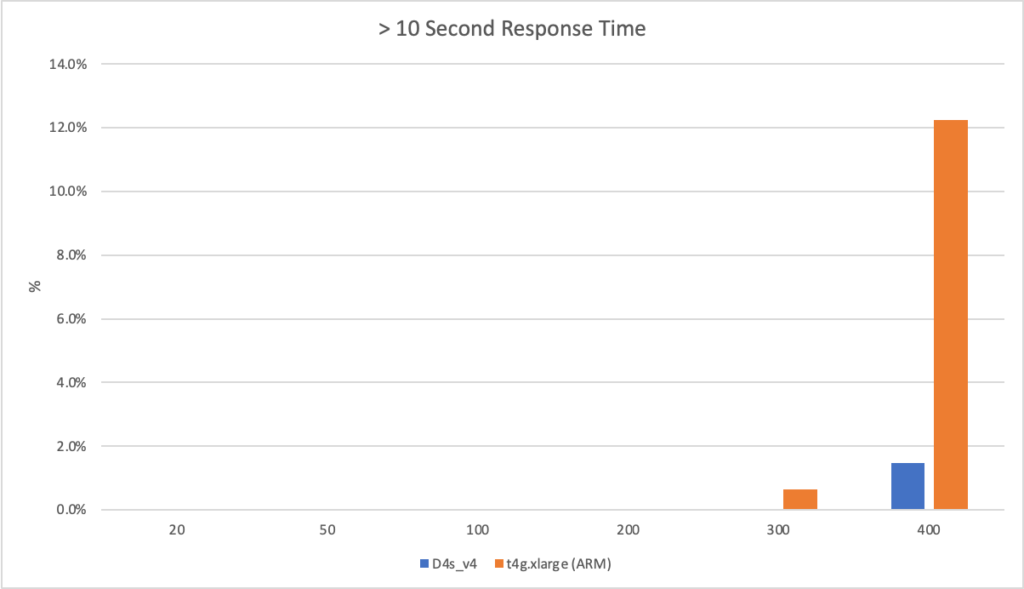
I then ran the workloads with different numbers of clients per seconds and measured their response times and the failure rate (failure being categorised as a response of > 10 seconds):

The Azure instance failed the 55 client per second rate – it had so many responses above 10 seconds in duration that the load test tool aborted the test.

Its clear from these graphs that the ARM VM running on AWS outperforms Azure both in terms of response time and massively in terms of bang for buck – its nearly half the price of the corresponding Azure VM.

Starter Workloads

One of the nice things about AWS and Azure is they offer very cheap VMs. The Azure VMs are burstable (and there is some complexity here with banked credits) which makes them hard to measure but as we saw in a previous post the ARM machines perform very well at this level.

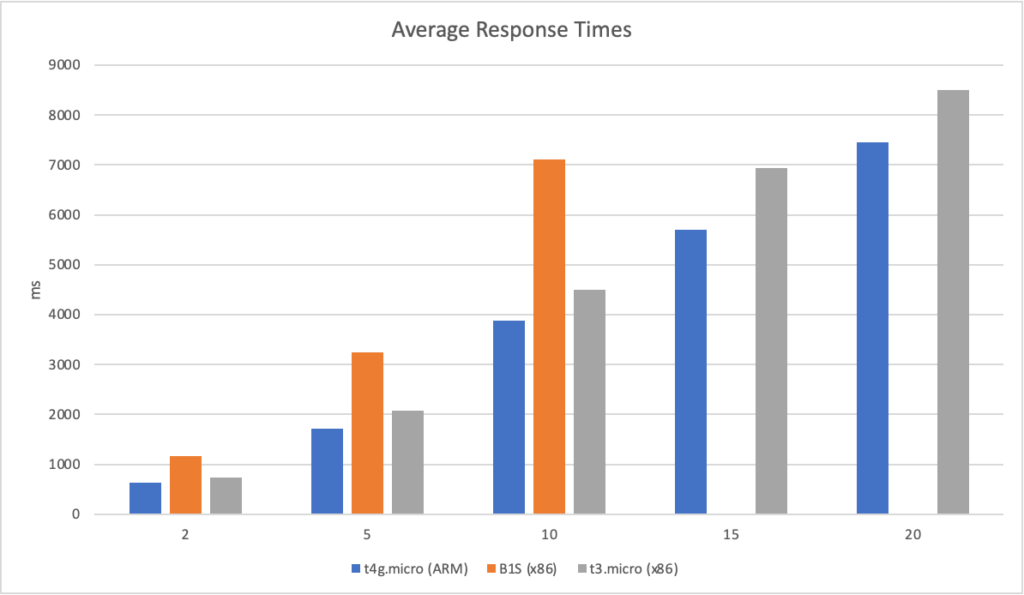
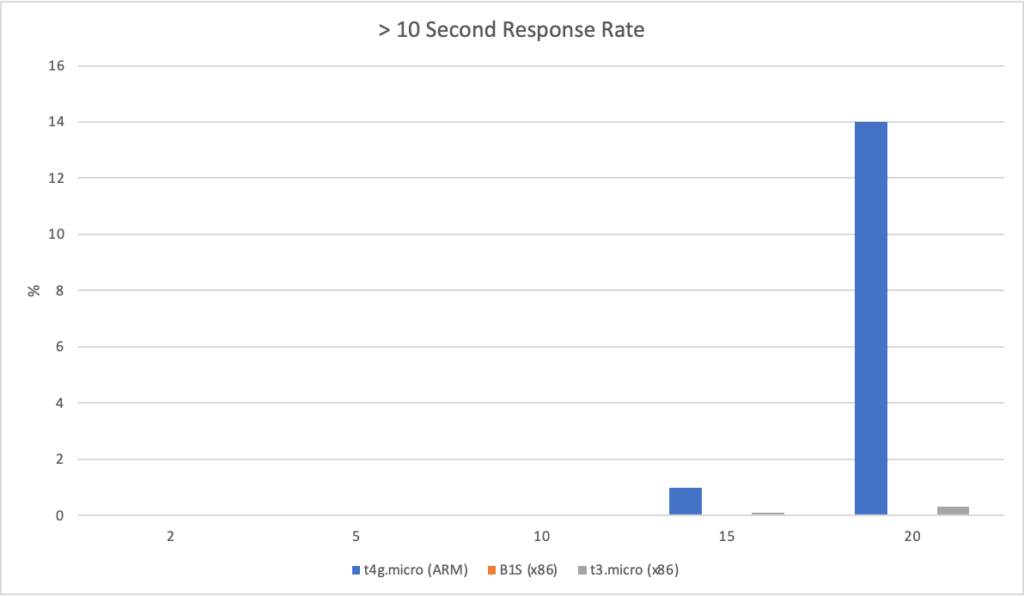
The three machines used are:

AWS (ARM): t4g.micro, 2 core, 1GiB of RAM costing $0.00840 per hour
Azure (x86): B1S, 1 core, 1GiB of RAM costing $0.00690 per hour
AWS (x86): t3.micro, 2 core, 1 GiB of RAM costing $0.00840 per hour

Its an easy victory for ARM on AWS here – its performant, cheap and predictable. The B1S instance on Azure couldn’t handle 15 or 20 clients per second at all but may be worth consideration if its bursting system works for you.

Simulated Async Workload

2 Core Tests

For these tests I used the same configurations as in the computational workload.

Their is less to separate the processors and vendors with a less computationally intensive workload. Interestingly the AWS machines have a less stable response time with more > 10 second response times but, in the case of the ARM chip, it does this while holding a lower average response time while under load.

Its worth noting that the ARM VM is doing this at 40% of the cost of the Azure VM and so I would argue again represents the best bang for buck. The AWS x86 VM is 20% cheaper than the Azure equivelant – if you can live with the extra “chop” that may still be worth it or you can use that saving to purchase a bigger tier unit.

4 Core Tests

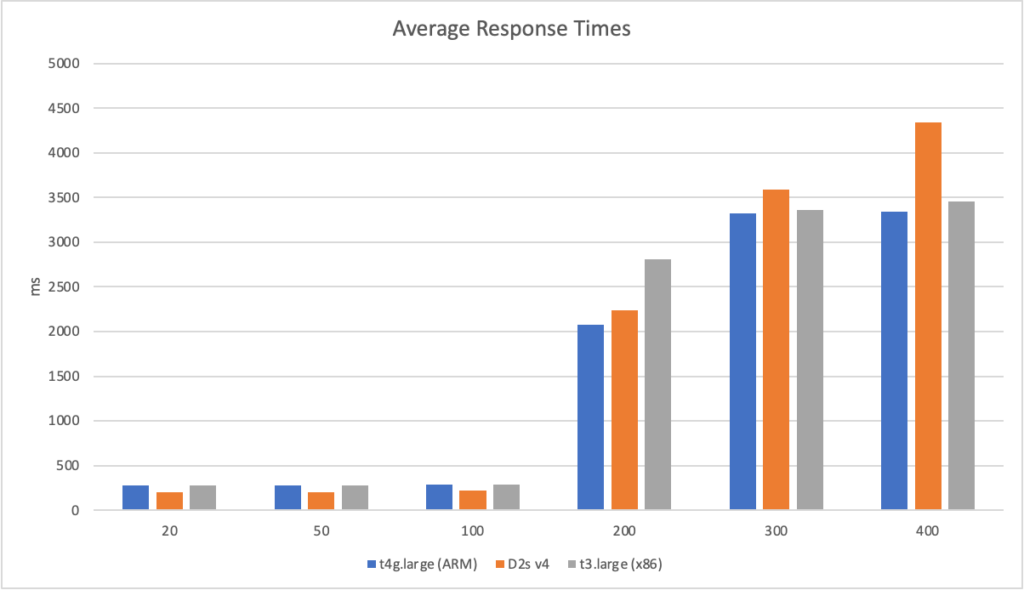
For these tests I used the same virtual machines as for the computational workload:

There is little to separate the two VMs until they come under heavy load at which point we see mixed results – I would argue the ARM VM suffers more as it becomes much more spiky with no consistent benefit in average response time.

However in terms of bang for buck – this ARM VM is nearly half the price of the Azure VM. There’s no contest. I could put two of these behind a load balancer for nearly the same cost.

Starter Workloads

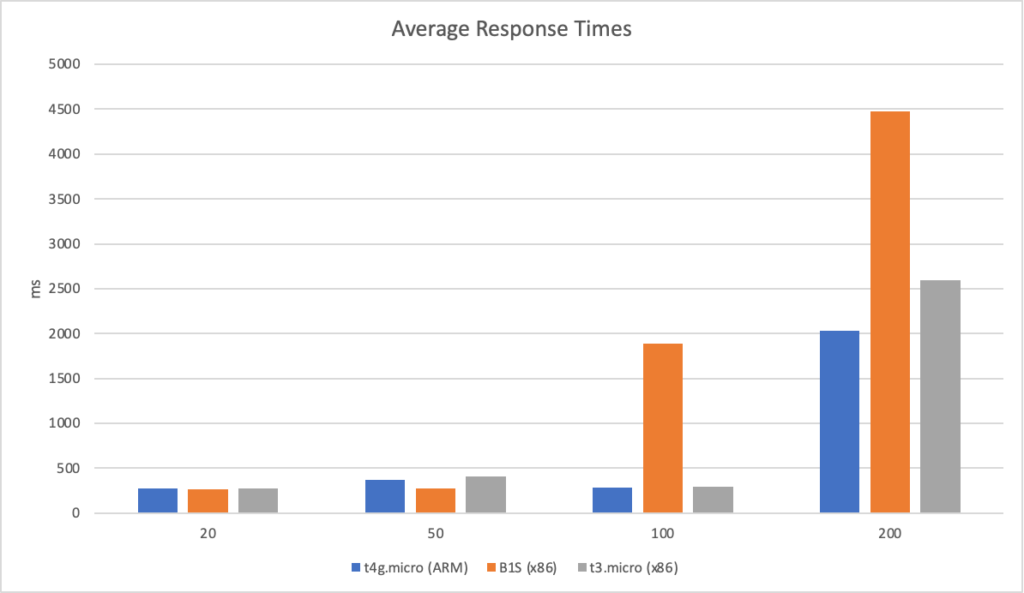
For these tests I used the same virtual machines as for the computational workload:

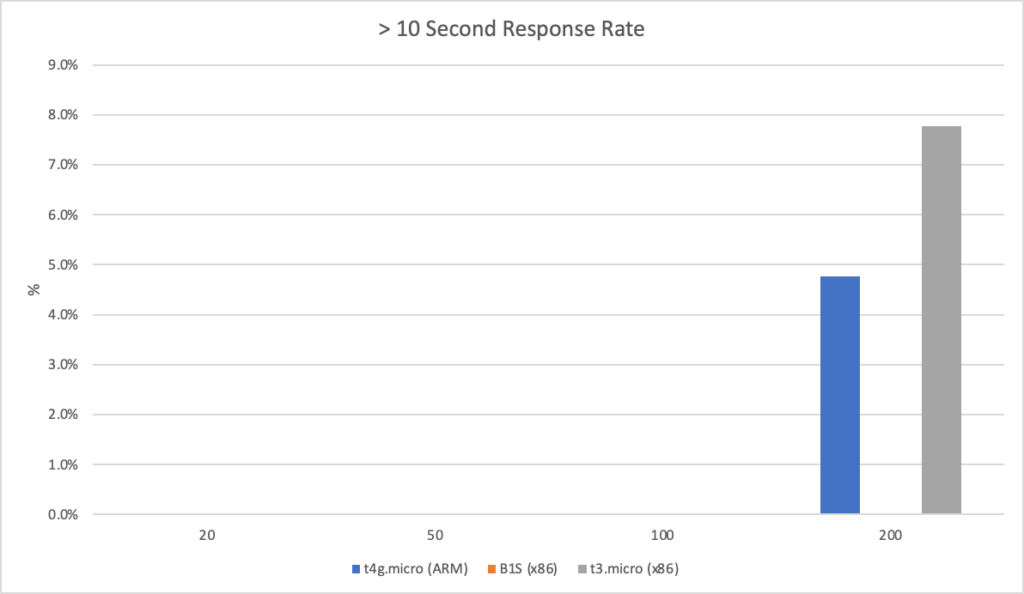
Its a pretty even game here until we hit the 100 client per second range at which point the AWS VMs begin to outperform the Azure VM though at the 200 client per second range at the expense of more long response times.

Conclusions

Given the results, at least with these workloads, its hard not to conclude that AWS currently offers significantly greater bang for buck than Azure for compute. Particularly with their use of ARM processors AWS seem to have taken a big leap ahead in terms of value for money for which, at the moment, Azure doesn’t look to have any response.

Perhaps tailoring Azure VMs to your specific workloads may get you more mileage.

I’ve tried to measure raw compute here in the simplest way I can – I’d stress that if you use more managed services you may see a different story (though ultimately its all running on the same infrastructure so my suspicion is not). And as always, particularly if you’re considering a switch of vendor, I’d recommend running and measuring representative workloads.

Full Results

TestVendorInstanceClients per secondMinMaxAverageSuccessful ResponsesTimeouts> 10 secondsPrice per hour
MandelbrotAzureA2_V2 (x64)29179279346000.0%$0.10600
MandelbrotAzureA2_V2 (x64)51263664939755600.0%$0.10600
MandelbrotAzureA2_V2 (x64)101205102037985342138.2%$0.10600
MandelbrotAzureA2_V2 (x64)15ERROR RATE TOO HIGH#DIV/0!$0.10600
MandelbrotAzureA2_V2 (x64)20ERROR RATE TOO HIGH#DIV/0!$0.10600
AsyncAzureA2_V2 (x64)2017334325260000.0%$0.10600
AsyncAzureA2_V2 (x64)50196504274149800.0%$0.10600
AsyncAzureA2_V2 (x64)10023942402484179400.0%$0.10600
AsyncAzureA2_V2 (x64)20042389295475172500.0%$0.10600
MandelbrotAzureB1S (x86)2670255111715700.0%$0.00690
MandelbrotAzureB1S (x86)51612552132527200.0%$0.00690
MandelbrotAzureB1S (x86)1012591000171157222.7%$0.00690
MandelbrotAzureB1S (x86)15ERROR RATE TOO HIGH$0.00690
AsyncAzureB1S (x64)2020638326858000.0%$0.00690
MandelbrotAzureB1S (x86)20ERROR RATE TOO HIGH$0.00690
AsyncAzureB1S (x64)50209436278149800.0%$0.00690
AsyncAzureB1S (x64)10029231511892225200.0%$0.00690
AsyncAzureB1S (x64)20048277084474213600.0%$0.00690
MandelbrotAzureD1 v2 (x64)27488287876000.0%$0.08780
MandelbrotAzureD1 v2 (x64)52858424236467000.0%$0.08780
MandelbrotAzureD1 v2 (x64)1011921000175235758.1%$0.08780
MandelbrotAzureD1 v2 (x64)15ERROR RATE TOO HIGH$0.08780
MandelbrotAzureD1 v2 (x64)20ERROR RATE TOO HIGH$0.08780
AsyncAzureD1 v2 (x64)20$0.08780
AsyncAzureD1 v2 (x64)50168407244149900.0%$0.08780
AsyncAzureD1 v2 (x64)10024133981986215600.0%$0.08780
AsyncAzureD1 v2 (x64)20040791714927195100.0%$0.08780
MandelbrotAzureD2as_v425596045666000.0%$0.11100
MandelbrotAzureD2as_v455872606159613300.0%$0.11100
MandelbrotAzureD2as_v41013055920354113400.0%$0.11100
MandelbrotAzureD2as_v41513589607559612600.0%$0.11100
AsyncAzureD2as_v42020030523960000.0%$0.11100
MandelbrotAzureD2as_v4206381237974351043324.1%$0.11100
MandelbrotAzureD2as_v4251459102938850587054.7%$0.11100
AsyncAzureD2as_v450200312238149800.0%$0.11100
AsyncAzureD2as_v4100202347247300000.0%$0.11100
AsyncAzureD2as_v420029541292053427600.0%$0.11100
AsyncAzureD2as_v43003291126931904334230.5%$0.11100
AsyncAzureD2as_v440033817305397842472054.6%$0.11100
MandelbrotAWSt2.micro (x86)2675114010105800.0%$0.01160
MandelbrotAWSt2.micro (x86)5651532433327200.0%$0.01160
MandelbrotAWSt2.micro (x86)10186710193699956812.5%$0.01160
MandelbrotAWSt2.micro (x86)151445102039458324457.9%$0.01160
AsyncAWSt2.micro (x64)2024241229860000.0%$0.01160
MandelbrotAWSt2.micro (x86)201486102068895114078.4%$0.01160
AsyncAWSt2.micro (x64)50241545312149700.0%$0.01160
AsyncAWSt2.micro (x64)10024498292260198900.0%$0.01160
AsyncAWSt2.micro (x64)200347173753858211825210.6%$0.01160
MandelbrotAWSt3.micro (x86)27018857446000.0%$0.01040
MandelbrotAWSt3.micro (x86)58783313206910800.0%$0.01040
MandelbrotAWSt3.micro (x86)108558037449810300.0%$0.01040
MandelbrotAWSt3.micro (x86)159731020269308499.7%$0.01040
AsyncAWSt3.micro (x64)2023340227960000.0%$0.01160
MandelbrotAWSt3.micro (x86)201030102158495743532.1%$0.01040
AsyncAWSt3.micro (x64)502354912407149800.0%$0.01160
AsyncAWSt3.micro (x64)100235545292299400.0%$0.01160
AsyncAWSt3.micro (x64)20023417376259830892607.8%$0.01160
MandelbrotAWSt4g.large (ARM)26327796546000.0%$0.06720
MandelbrotAWSt4g.large (ARM)56982436175313700.0%$0.06720
MandelbrotAWSt4g.large (ARM)1019366284368213700.0%$0.06720
MandelbrotAWSt4g.large (ARM)1521209927562413300.0%$0.06720
MandelbrotAWSt4g.large (ARM)208651020774721003123.7%$0.06720
MandelbrotAWSt4g.large (ARM)25757102078432568058.8%$0.06720
AsyncAWSt4g.large (ARM)2023439828059900.0%$0.06720
AsyncAWSt4g.large (ARM)50229395275149800.0%$0.06720
AsyncAWSt4g.large (ARM)100236426287299200.0%$0.06720
AsyncAWSt4g.large (ARM)20031617359208040262606.1%$0.06720
AsyncAWSt4g.large (ARM)300241173813322306063917.3%$0.06720
AsyncAWSt4g.large (ARM)4003491312733464038108821.2%$0.06720
MandelbrotAWSt4g.micro (ARM)26187516386000.0%$0.00840
MandelbrotAWSt4g.micro (ARM)57652794170913200.0%$0.00840
MandelbrotAWSt4g.micro (ARM)107616958388213000.0%$0.00840
MandelbrotAWSt4g.micro (ARM)1575910203570412710.8%$0.00840
AsyncAWSt4g.micro (ARM)2023637127560000.0%$0.00840
MandelbrotAWSt4g.micro (ARM)208021020774591191410.5%$0.00840
AsyncAWSt4g.micro (ARM)502224178373149800.0%$0.00840
AsyncAWSt4g.micro (ARM)100231414286299400.0%$0.00840
AsyncAWSt4g.micro (ARM)20031017388202839952004.8%$0.00840
AsyncAzureD4s_v42016723920060000.0%$0.22200
AsyncAzureD4s_v450165242197149900.0%$0.22200
AsyncAzureD4s_v4100153243198300000.0%$0.22200
AsyncAzureD4s_v4200165270204600000.0%$0.22200
AsyncAzureD4s_v430020899621395790000.0%$0.22200
AsyncAzureD4s_v440021116283204976951141.5%$0.22200
MandelbrotAzureD4s_v423043343136000.0%$0.22200
MandelbrotAzureD4s_v4541567550015000.0%$0.22200
MandelbrotAzureD4s_v41048834501670238800.0%$0.22200
MandelbrotAzureD4s_v4154864371301225600.0%$0.22200
MandelbrotAzureD4s_v4207276572402723900.0%$0.22200
MandelbrotAzureD4s_v42514538024512723500.0%$0.22200
MandelbrotAzureD4s_v4308869282598823800.0%$0.22200
MandelbrotAzureD4s_v435613100056850196198.8%$0.22200
MandelbrotAzureD4s_v4401817133527905215146.1%$0.22200
MandelbrotAzureD4s_v44524121020786392044116.7%$0.22200
MandelbrotAzureD4s_v4507471020789538015866.4%$0.22200
MandelbrotAzureD4s_v455ERROR RATE TOO HIGH
MandelbrotAzureD2s v424594824696000.0%$0.11100
MandelbrotAzureD2s v458833449176412300.0%$0.11100
MandelbrotAzureD2s v4104806747405312300.0%$0.11100
MandelbrotAzureD2s v41548310202628611810.8%$0.11100
MandelbrotAzureD2s v420506102067636862824.6%$0.11100
MandelbrotAzureD2s v425ERROR RATE TOO HIGH$0.11100
AsyncAzureD2s v42016827020658000.0%$0.11100
AsyncAzureD2s v450164266205149900.0%$0.11100
AsyncAzureD2s v4100167310217300000.0%$0.11100
AsyncAzureD2s v420025938182233399000.0%$0.11100
AsyncAzureD2s v43002491560335923808120.3%$0.11100
AsyncAzureD2s v440033016811434139142034.9%$0.11100
MandelbrotAWSt3.large (x86)27118787536000.0%$0.08320
MandelbrotAWSt3.large (x86)57583150202411300.0%$0.08320
MandelbrotAWSt3.large (x86)1010237656439311500.0%$0.08320
MandelbrotAWSt3.large (x86)15234010202661510443.7%$0.08320
MandelbrotAWSt3.large (x86)202453104068479475453.5%$0.08320
MandelbrotAWSt3.large (x86)25ERROR RATE TOO HIGH$0.08320
AsyncAWSt3.large (x86)2023438028060000.0%$0.08320
AsyncAWSt3.large (x86)50230386276144800.0%$0.08320
AsyncAWSt3.large (x86)100235424287299000.0%$0.08320
AsyncAWSt3.large (x86)20023717373280830262708.2%$0.08320
AsyncAWSt3.large (x86)300230173823358312760316.2%$0.08320
AsyncAWSt3.large (x86)4005511312734513664108822.9%$0.08320
AsyncAWSt4g.xlarge (ARM)2023138427459900.0%$0.13440
AsyncAWSt4g.xlarge (ARM)50221380273149800.0%$0.13440
AsyncAWSt4g.xlarge (ARM)100221382273299500.0%$0.13440
AsyncAWSt4g.xlarge (ARM)200222395276600000.0%$0.13440
AsyncAWSt4g.xlarge (ARM)300266102097068699560.6%$0.13440
AsyncAWSt4g.xlarge (ARM)4002581110619537793108812.3%$0.13440
MandelbrotAWSt4g.xlarge (ARM)26337796466000.0%$0.13440
MandelbrotAWSt4g.xlarge (ARM)5581111573715000.0%$0.13440
MandelbrotAWSt4g.xlarge (ARM)106134203154026400.0%$0.13440
MandelbrotAWSt4g.xlarge (ARM)1510796666270826400.0%$0.13440
MandelbrotAWSt4g.xlarge (ARM)2011786820372327200.0%$0.13440
MandelbrotAWSt4g.xlarge (ARM)257518171442526400.0%$0.13440
MandelbrotAWSt4g.xlarge (ARM)3067710231555526562.2%$0.13440
MandelbrotAWSt4g.xlarge (ARM)35687102456356239259.5%$0.13440
MandelbrotAWSt4g.xlarge (ARM)40895103347353229228.8%$0.13440
MandelbrotAWSt4g.xlarge (ARM)4510411020780441995321.0%$0.13440
MandelbrotAWSt4g.xlarge (ARM)5012361020686241737630.5%$0.13440
MandelbrotAWSt4g.xlarge (ARM)55119310206917910516160.5%$0.13440

.NET 5 – ARM vs x64 in the Cloud Part 2 – Azure

Having conducted my ARM and x64 tests on AWS yesterday I was curious to see how Azure would fair – it doesn’t support ARM but ultimately that’s a mechanism for delivering value (performance and price) and not an end in and of itself. And so this evening I set about replicating the tests on Azure.

In the end I’ve massively limited my scope to two instance sizes:

  1. A2 – this has 2 CPUs and 4Gb of RAM (much more RAM than yesterdays) and costs $0.120 per hour
  2. B1S – a burstable VM that has 1 CPUand 1Gb RAM (so most similar to yesterdays t2.micro) and costs $0.0124 per hour

Note – I’ve begun to conduct tests on D series too, preliminary findings is that the D1 is similar to the A2 in performance characteristics.

I was struggling to find Azure VMs with the same pricing as AWS and so had to start with a burstable VM to get something in the same kind of ballpark. Not ideal but they are the chips you are dealt on Azure! I started with the B1S which was still more expensive than the ARM VM. I created the VM, installed software, and ran the tests – the machine comes with 30 credits for bursting. However after running tests several times it was still performing consistently so these were either exhausted quickly, made little difference, or were used consistently.

I moved to the A2_V2 because, frankly, the performance was dreadful on my early tests with the B1S and I also wanted something that wouldn’t burst. I was also trying to match the spec of the AWS machines – 2 cores and 1Gb of RAM. I’ll attempt the same tests with a D series when I can.

Test setup was the same and all tests are run on VMs accessed directly on their public IP using Apache as a reverse proxy to Kestrel and our .NET application.

I’ve left the t2.micro instance out of this analysis

Mandelbrot

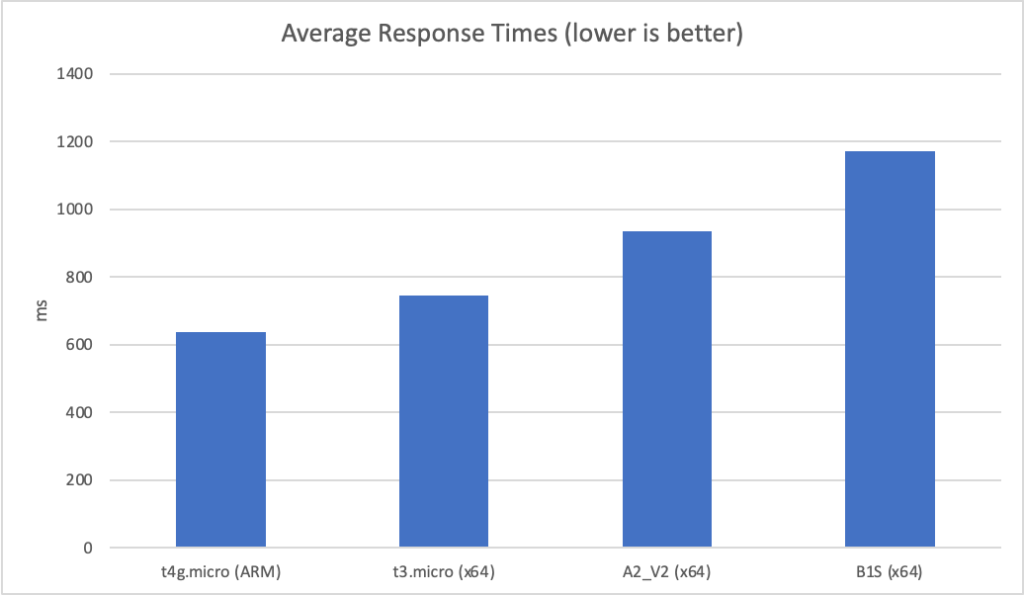
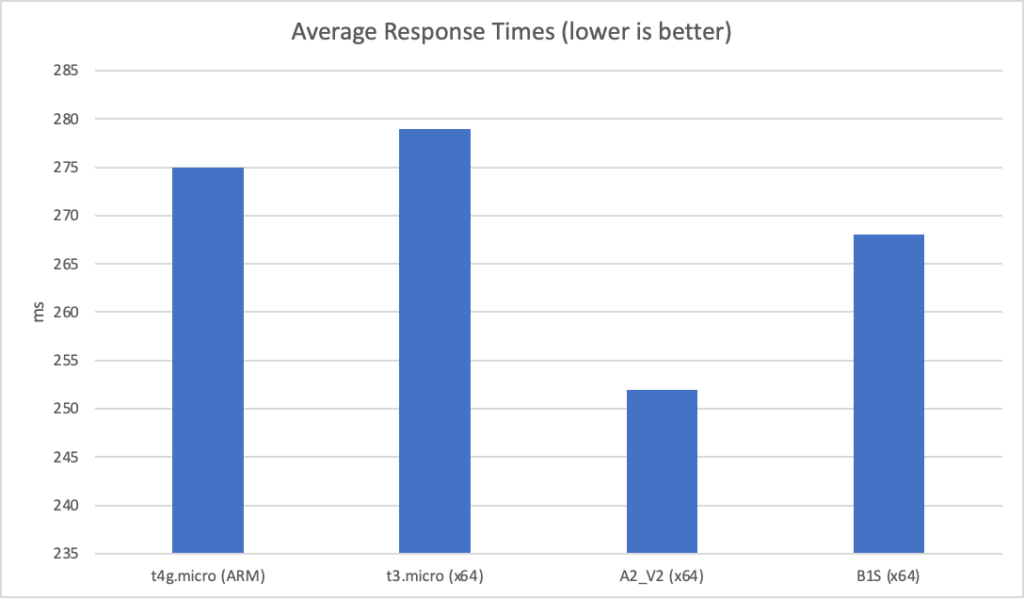
With 2 clients per test we see the following response times:

We can see that the two Azure instances are already off to a bad start on this computationally heavy test.

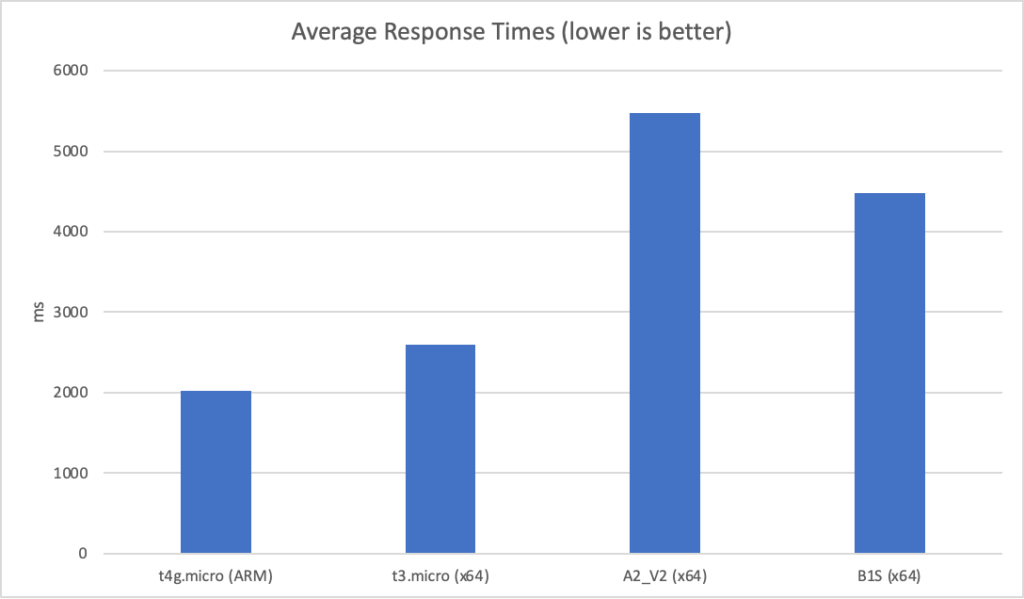
At 10 clients per second we continue to see this reflected:

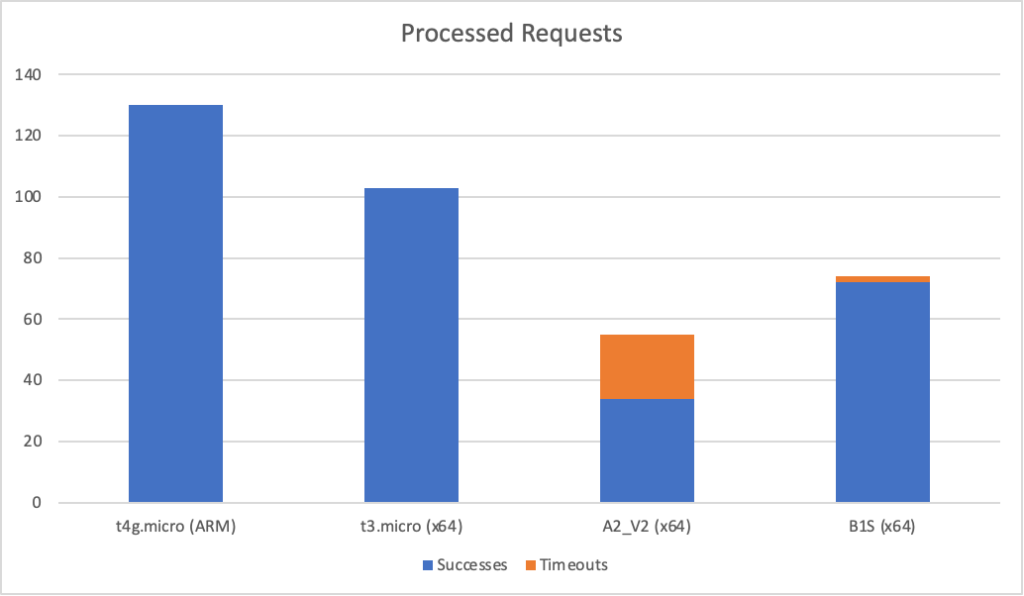
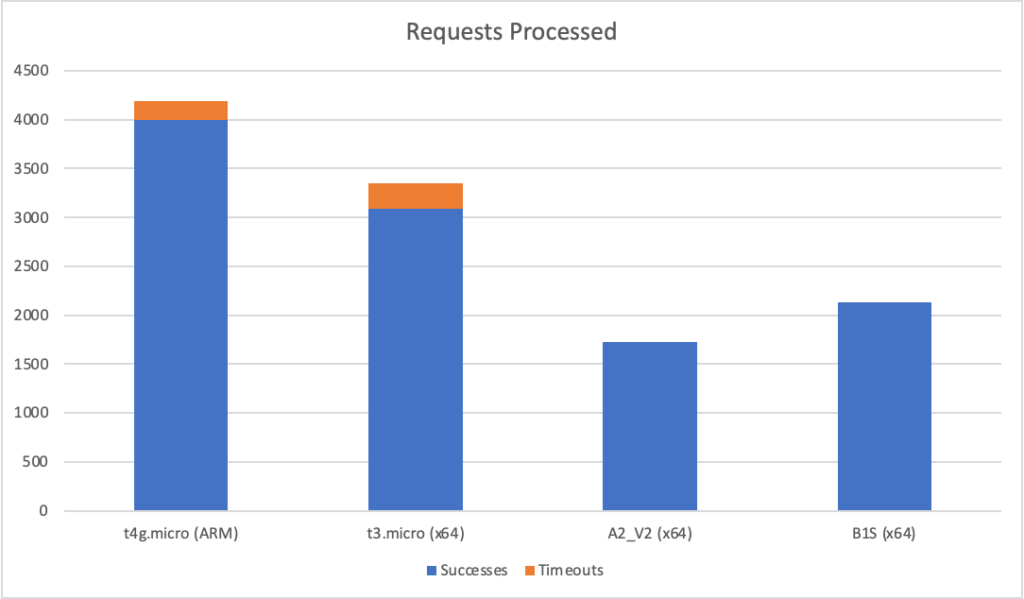
However at this point the two Azure instances begin to experience timeout failures (the threshold being set at 10 seconds in the load tester):

The A2_V2 instance is faring particularly badly particularly given it is 10x the cost of the AWS instances.

Unfortunately their is no meaningful compaison I can make under higher load as both Azure instances collapse when I push to 15 clients per second. For complete sake here are the results on AWS at 20 clients per second (average response and total requests):

Simulated Async Workload

With our simulated async workload Azure fares better at low scale. Here are the results at 20 requests per second:

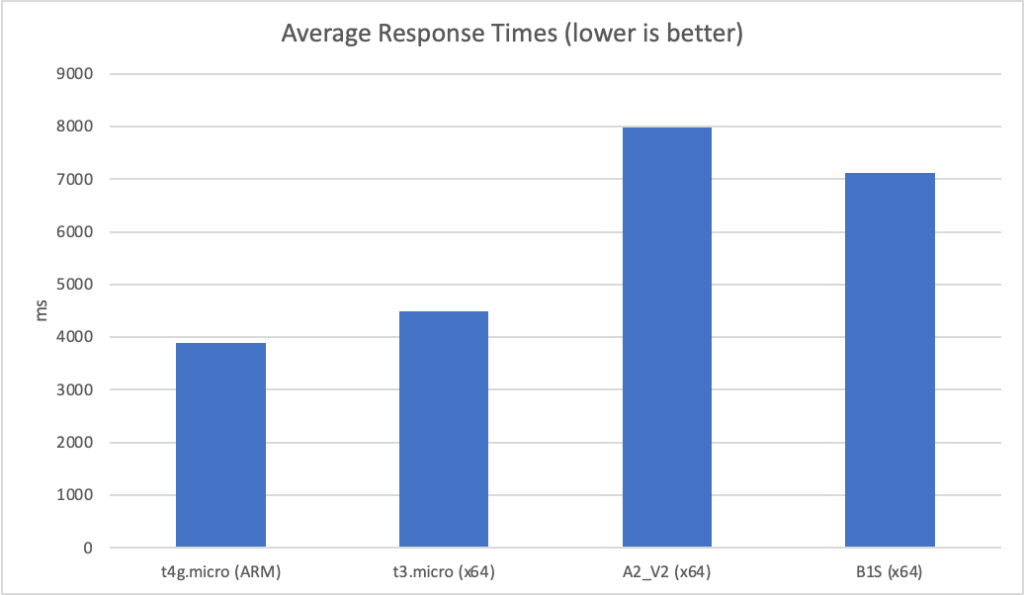
As we push the scale up things get interesting with different patterns across the two vendors. Here are the average response times at 200 clients per second:

At first glance AWS looks to be running away with things however both the t4g.micro and t3.micro suffer from performance degradation at the extremes – the max response time is 17 seconds for both while for the Azure instances it is around 9 seconds.

You can see this reflected in the success and total counts where the AWS instances see a number of timeout failures (> 10 seconds) while the Azure instances stay more consistent:

However the AWS instances have completed many more requests overall. I’ve not done a percentile breakdown (see comments yesterday) but it seems likely that at the edges AWS is fraying and degrading more severely than Azure leading to this pattern.

Conclusions

The different VMs clearly have different strengths and weaknesses however in the computational test the Azure results are disappointing – the VMs are more expensive yet, at best, offer performance with different characteristics (more consistent when pushed but lower average performance – pick your poison) and at worst offer much lower performance and far less value for money. They seem to struggle with computational load and nosedive rapdily when pushed in that scenario.

Full Results

TestVendorInstanceClients per secondMinMaxAverageSuccessful ResponsesTimeouts
MandelbrotAWSt4g.micro (ARM)2618751638600
MandelbrotAWSt4g.micro (ARM)5765279417091320
MandelbrotAWSt4g.micro (ARM)10761695838821300
MandelbrotAWSt4g.micro (ARM)157591020357041271
MandelbrotAWSt4g.micro (ARM)2080210207745911914
MandelbrotAWSt3.micro (x64)2701885744600
MandelbrotAWSt3.micro (x64)5878331320691080
MandelbrotAWSt3.micro (x64)10855803744981030
MandelbrotAWSt3.micro (x64)15973102026930849
MandelbrotAWSt3.micro (x64)2010301021584957435
MandelbrotAWSt2.micro (x64)267511401010580
MandelbrotAWSt2.micro (x64)565153243332720
MandelbrotAWSt2.micro (x64)101867101936999568
MandelbrotAWSt2.micro (x64)1514451020394583244
MandelbrotAWSt2.micro (x64)2014861020688951140
MandelbrotAzureA2_V2 (x64)2917927934600
MandelbrotAzureA2_V2 (x64)5126366493975560
MandelbrotAzureA2_V2 (x64)1012051020379853421
MandelbrotAzureA2_V2 (x64)15ERROR RATE TOO HIGH
MandelbrotAzureA2_V2 (x64)20ERROR RATE TOO HIGH
MandelbrotAzureB1S (x64)267025511171570
MandelbrotAzureB1S (x64)5161255213252720
MandelbrotAzureB1S (x64)101259100017115722
MandelbrotAzureB1S (x64)15ERROR RATE TOO HIGH
MandelbrotAzureB1S (x64)20ERROR RATE TOO HIGH
AsyncAWSt4g.micro (ARM)202363712756000
AsyncAWSt4g.micro (ARM)50222417837314980
AsyncAWSt4g.micro (ARM)10023141428629940
AsyncAWSt4g.micro (ARM)2003101738820283995200
AsyncAWSt3.micro (x64)202334022796000
AsyncAWSt3.micro (x64)50235491240714980
AsyncAWSt3.micro (x64)10023554529229940
AsyncAWSt3.micro (x64)2002341737625983089260
AsyncAWSt2.micro (x64)202424122986000
AsyncAWSt2.micro (x64)5024154531214970
AsyncAWSt2.micro (x64)1002449829226019890
AsyncAWSt2.micro (x64)2003471737538582118252
AsyncAzureA2_V2 (x64)201733432526000
AsyncAzureA2_V2 (x64)5019650427414980
AsyncAzureA2_V2 (x64)1002394240248417940
AsyncAzureA2_V2 (x64)2004238929547517250
AsyncAzureB1S (x64)202063832685800
AsyncAzureB1S (x64)5020943627814980
AsyncAzureB1S (x64)1002923151189222520
AsyncAzureB1S (x64)2004827708447421360

.NET 5 – ARM vs x64 in the Cloud

With Microsoft and Apple both now beginning to use ARM chips in laptops, what was traditionally the domain of x86/x64 architecture, I found myself curious as to the ramifications of this move – particularly by Apple who are transitioning their entire lineup to ARM over the next 2 years.

While musing on the pain points of this I found myself wandering if Azure supported ARM processors, they don’t, and got pointed to AWS who do. @thebeebs (an AWS developer advocate) mentioned that some customers had seen significant cost reductions by moving some workloads over to ARM and so I, inevitably, found myself curious as to how typical .NET workloads might run in comparison to x64 and set about some tests.

The Tests

I quickly rustled up a simple API containing two invocable workloads:

  1. A computation heavy workload – I’m rendering a Mandelbrot and returning it as an image. This involves floating point maths.
  2. A simulated await workload – often with APIs we hand off to some other system (e.g. a database) and then do a small amount of computation. I’ve simulated this with Task.Delay and a (very small) random factor to simulate the slight variations you will get with any network / remote service request and then around this I compute two tiny Mandelbrots and return a couple of numbers. It would be nice to come back at some point and use a more structured approach for the simulated remote latency.

I’ve written this in F# (its not particularly “functional”) using Giraffe on top of ASP.Net Core just because that’s my go to language these days. Its running under the .NET 5 runtime.

The code for this is here. Its not particularly elegant and I simply converted some old JavaScript code of mine into F# for the Mandelbrot. It does a job.

The Setup

Within AWS I created three EC2 Linux instances:

  1. t4g.micro – ARM based, 2 vCPU, 1Gb memory, $0.0084 per hour
  2. t3.micro – x64 based, 2 vCPU, 1Gb memory, $0.0104 per hour
  3. t2.micro – x64 based, 1 vCPU, 1Gb memory, $0.0116 per hour

Its worth noting that my ARM instance is costing me 20% less than the t3.micro.

I’ve deliberately chosen very small instances in order to make it easier to stress them without having to sell a kidney to fund the load testing. We should be able to stress these instances quite quickly.

I then SSHed into each box and installed .NET 5 from the appropriate binaries and setup Apache as a reverse proxy. On the ARM machine I also had to install GCC and compile a version of libicui18n for .NET to work.

Next I used git clone to bring down the source and ran dotnet restore followed by dotnet run. At this point I had the same code working on each of my EC2 instances. Easy to verify as the root of the site shows a Mandelbrot:

This was all pretty easy to set up. You can also do it using a Cloud Formation sample that I was pointed at (again by @thebeebs).

I still think its worth remarking how much .NET has changed in the last few years – I’ve not touched Windows here and have the same source running on two different CPU architectures with no real effort on my part. Yes its “get through the door” stakes these days but it was hard to imagine this a few years back.

Benchmarks

My tests were fairly simple – I’ve used loader.io to maintain a steady state of a given number of clients per second and gathered up the response times and total execution counts along with the number of timeouts. I had the timeout threshold set at 10 seconds.

Time allowing I will come back to this and run some percentile analysis – loader doesn’t support this and so I would need to do some additional work.

I’ve run the test several times and averaged the results – though they were all in the same ballpark.

Mandelbrot

Firstly as a baseline lets look at things running with just two clients per second:

With little going on we can see that the ARM instance already has a slight advantage – its consistently (min, max and average) around 100ms faster than the closest x64 based instance.

Unsurprisingly if we push things a little harder to 5 clients per second this becomes magnified:

We’re getting no errors or timeouts at this point and you can see the total throughput over the 30 second run below:

The ARM instance has completed around 20% more requests than the nearest x64 instance, with a 18% improvement in average response time and at 80% of the cost.

And if we push this out to 20 clients per second (my largest scale test) the ARM instance looks better again:

Its worth noting that at this point all three instances are generating timeouts in our load test suite but again the ARM instance wins out here – we get fewer timeouts and get through more overall requests:

You can see from this that our ARM instance is performing much better under this level of load. We can say that:

  • Its successfully completed 60% more requests than the nearest x64 instance
  • It has a roughly 12% improvement on average response time
  • And it is doing this at 80% of the cost of the x64 instance

With our Mandelbrot test its clear that the ARM instance has a consistent advantage both in performance and cost.

Simulated Async Workload

Starting again with a low scale test (in this case 50 clients per second – this test spends significant time awaiting) in this case we can see that our t2 x64 instance had an advantage of around 40ms:

However if we move up to 100 clients per second we can see the t2 instance essentially collapse while out t4g ARM instance and t3 x64 instance are essentially level pegging (286ms and 292ms) respectively:

We get no timeouts at this point and our ARM and x64 instance level peg again on total requests:

However if we push on to a higher scale test (200 clients per second) we can see the ARM instance begin to pull ahead:

Conclusions

Going into this I really didn’t know what to expect but these fairly simple tests suggest their is an economic advantage to running under ARM in the cloud. At worst you will see comparable performance at a lower price point but for some workloads you may see a significant performance gain – again at a lower price point.

20% performance gain at 80% the price is most certainly not to be sniffed at and for large workloads could quickly offset the cost of moving infrastructure to ARM.

Presumably the price savings are due to the power efficiency of the ARM chips. However what is hard to tell is how much of the pricing is “early adopter” to encourage people to move to CPUs that have long term advantage to cloud vendors (even minor power efficiency gains over cloud scale data centers must total significant numbers on the bottom line) and how much of that will be sustained and passed on to users in the long term.

Doubtless we’ll land somewhere in the middle.

Question I have now is: where the heck is Azure in all this? Between Lambda and ARM on AWS its hard not to feel as if the portability advantages, both processor and OS, of .NET Core / 5 are being realised more effectively by Amazon than they are by Microsoft themselves. Strange times.

Full Results

Response Times (ms)
TestInstanceClients per secondMinMaxAverageSuccessful ResponsesTimeouts
Mandelbrott4g.micro (ARM)2618751638600
Mandelbrott4g.micro (ARM)5765279417091320
Mandelbrott4g.micro (ARM)10761695838821300
Mandelbrott4g.micro (ARM)157591020357041271
Mandelbrott4g.micro (ARM)2080210207745911914
Mandelbrott3.micro (x64)2701885744600
Mandelbrott3.micro (x64)5878331320691080
Mandelbrott3.micro (x64)10855803744981030
Mandelbrott3.micro (x64)15973102026930849
Mandelbrott3.micro (x64)2010301021584957435
Mandelbrott2.micro (x64)267511401010580
Mandelbrott2.micro (x64)565153243332720
Mandelbrott2.micro (x64)101867101936999568
Mandelbrott2.micro (x64)1514451020394583244
Mandelbrott2.micro (x64)2014861020688951140
Asynct4g.micro (ARM)202363712756000
Asynct4g.micro (ARM)50222417837314980
Asynct4g.micro (ARM)10023141428629940
Asynct4g.micro (ARM)2003101738820283995200
Asynct3.micro (x64)202334022796000
Asynct3.micro (x64)50235491240714980
Asynct3.micro (x64)10023554529229940
Asynct3.micro (x64)2002341737625983089260
Asynct2.micro (x64)202424122986000
Asynct2.micro (x64)5024154531214970
Asynct2.micro (x64)1002449829226019890
Asynct2.micro (x64)2003471737538582118252

Azure Functions – Scaling with a Dedicated App Service Plan

Since I published this piece Microsoft have made significant improvements to HTTP scaling on Azure Functions. I’ve not yet had the opportunity to test performance on dedicated app service plans but please see this post for a revised comparison on the Consumption Plan.

After my last few posts on the scaling of Azure Functions I was intrigued to see if they would perform any better running on a dedicated App Service Plan. Hosting them in this way allows for the functions to take full advantage of App Service features but, to my mind, is no long a serverless approach as rather than being billed based on usage you are essentially renting servers and are fully responsible for scaling.

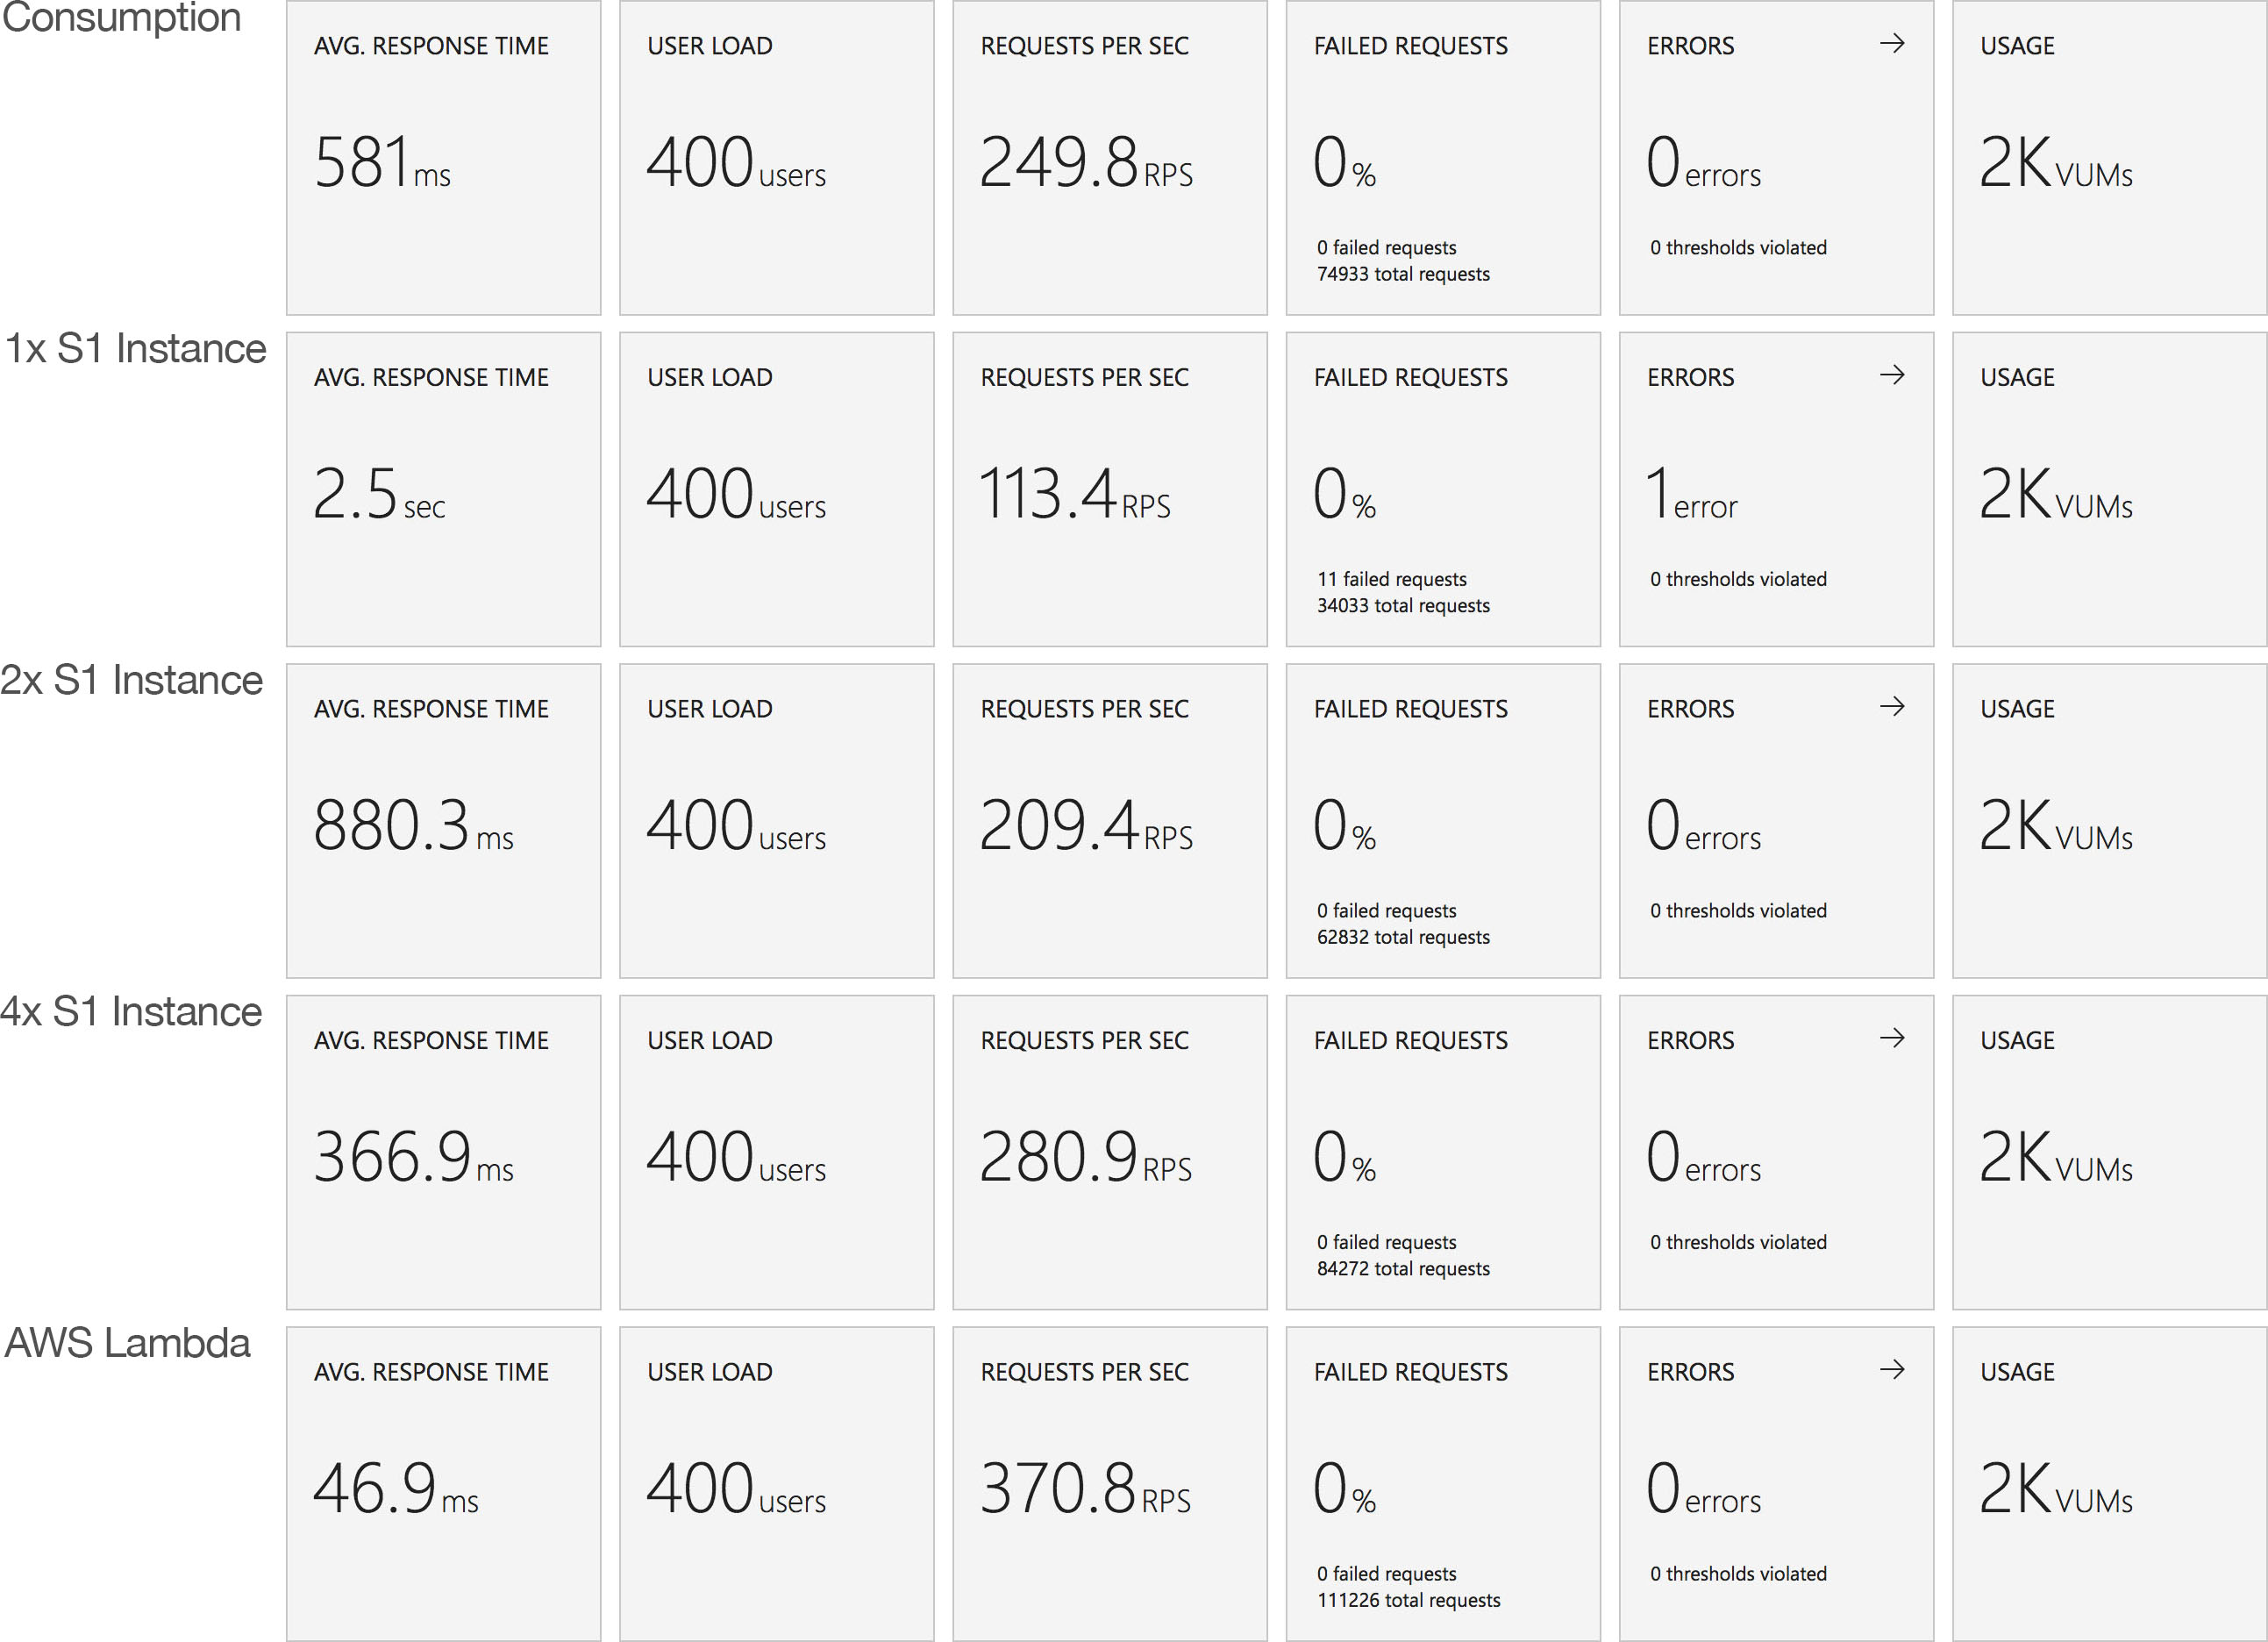
I conducted a single test scenario: an immediate load of 400 concurrent users running for 5 minutes against the “stock” JavaScript function (no external dependencies, just returns a string) on 4 configurations:

  1. Consumption Plan – billed based on usage – approximately $130 per month
    (based on running constantly at the tested throughput that is around 648 million functions per month)
  2. Dedicated App Service Plan with 1 x S1 server -$73.20 per month
  3. Dedicated App Service Plan with 2 x S1 server – $146.40 per month
  4. Dedicated App Service Plan with 4 x S1 server – $292.80 per month

I also included AWS Lambda as a reference point.

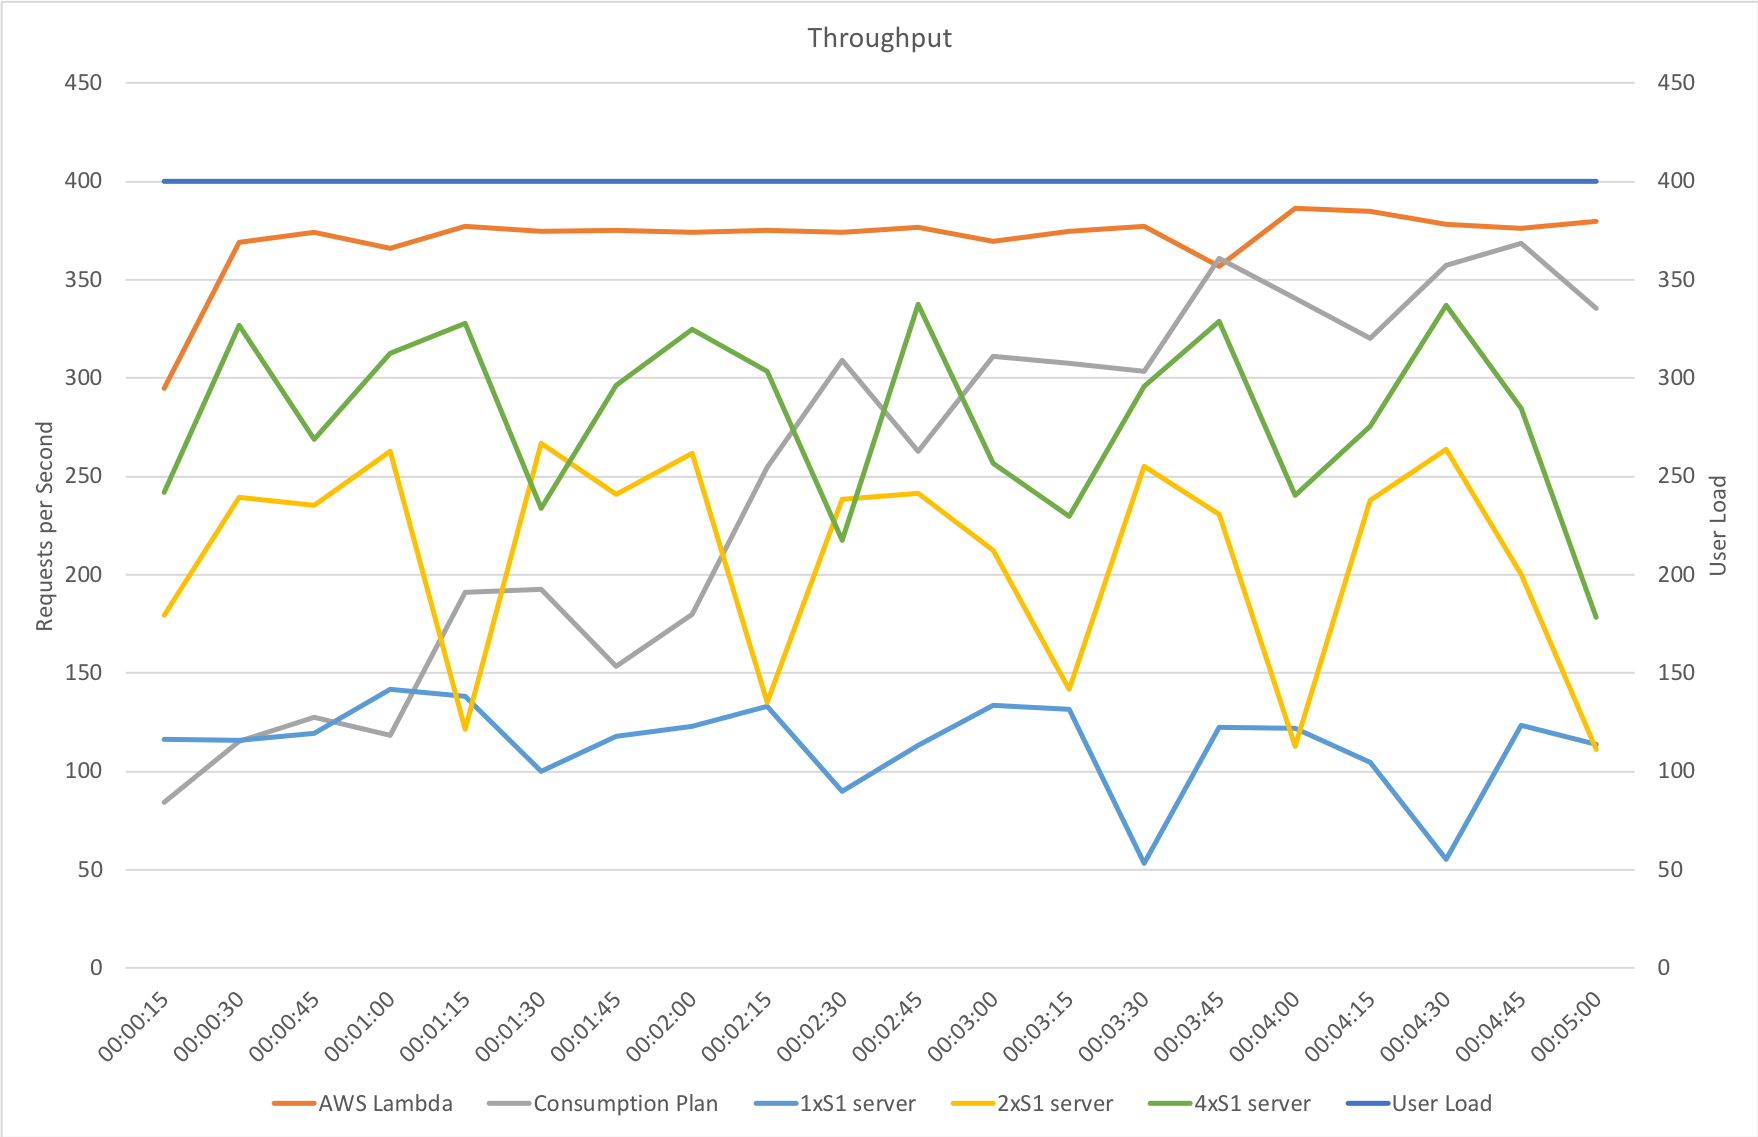
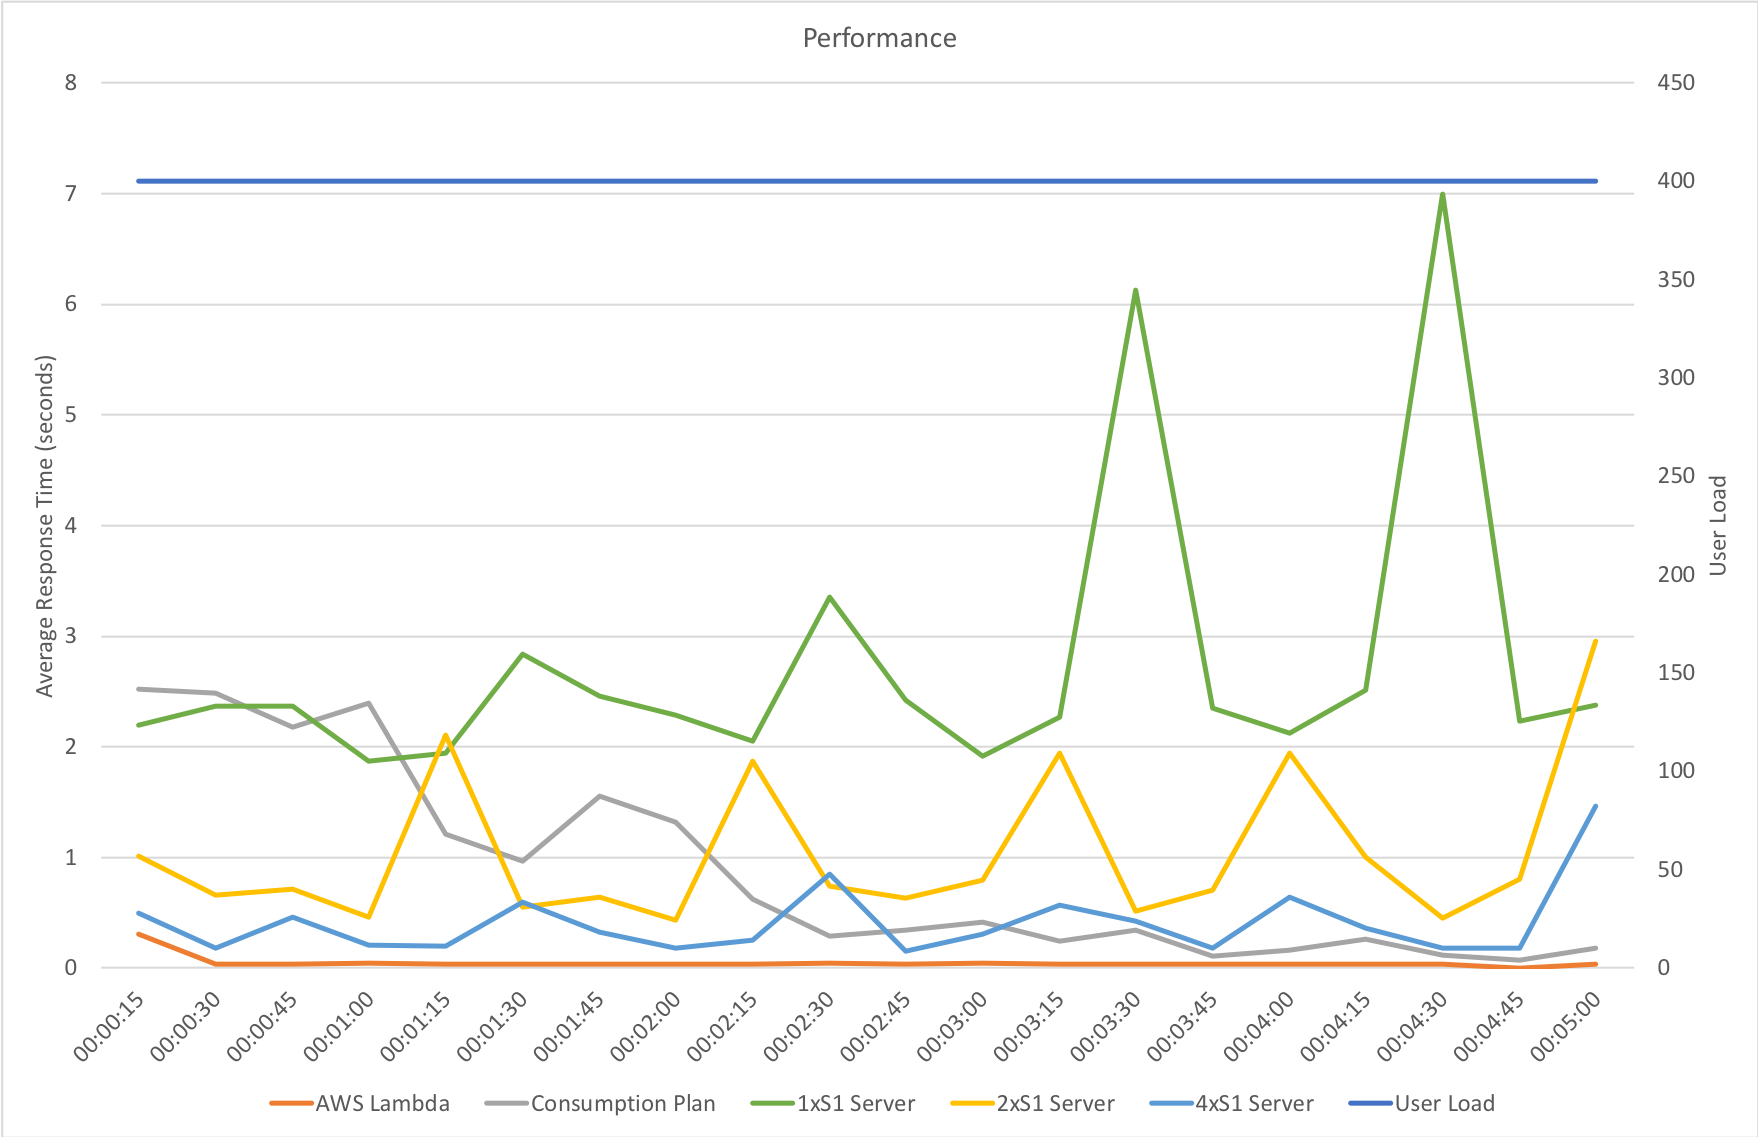
The results were certainly interesting:

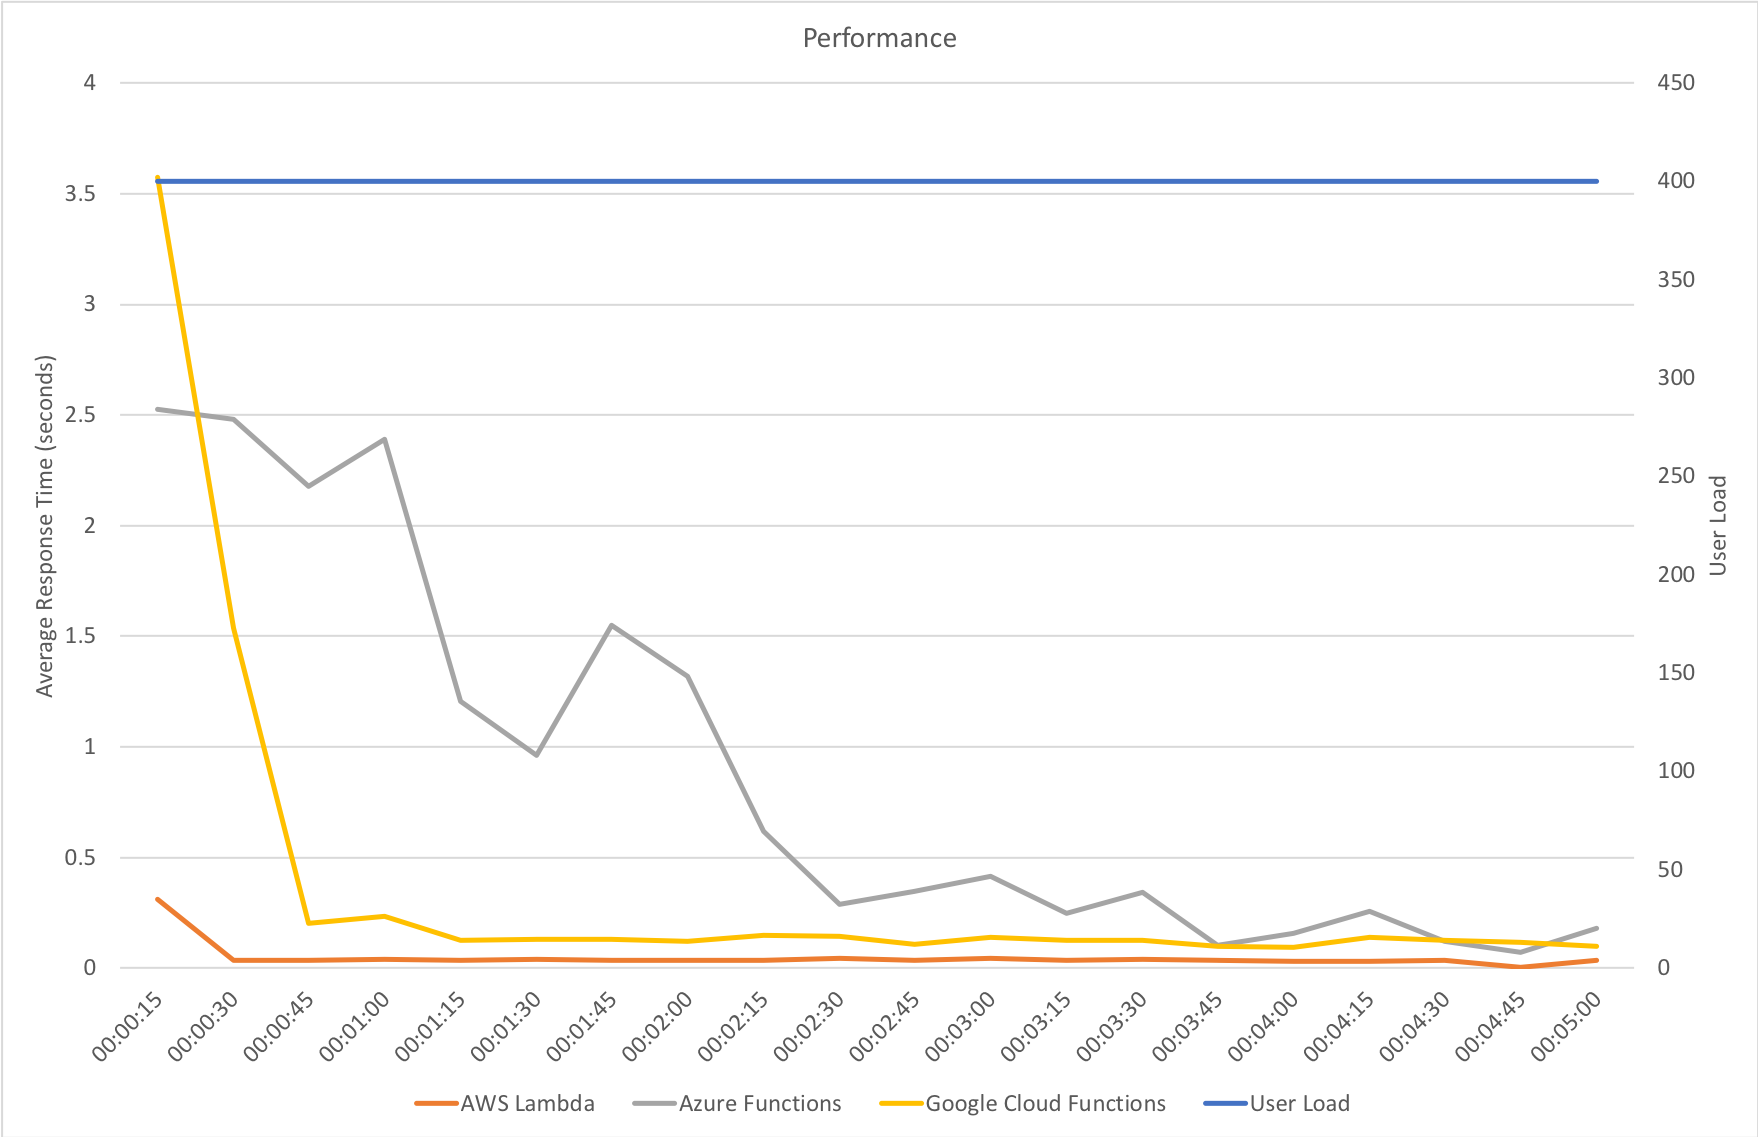
With immediately available resource all 3 App Service Plan configurations begin with response times slightly ahead of the Consumption Plan but at around the 1 minute mark the Consumption Plan overtakes our single instance configuration and at 2 minutes creeps ahead of the double instance configuration and, while the advantage is slight, at 3 minutes begins to consistently outperform our 4 instance configuration. However AWS Lambda remains some way out in front.

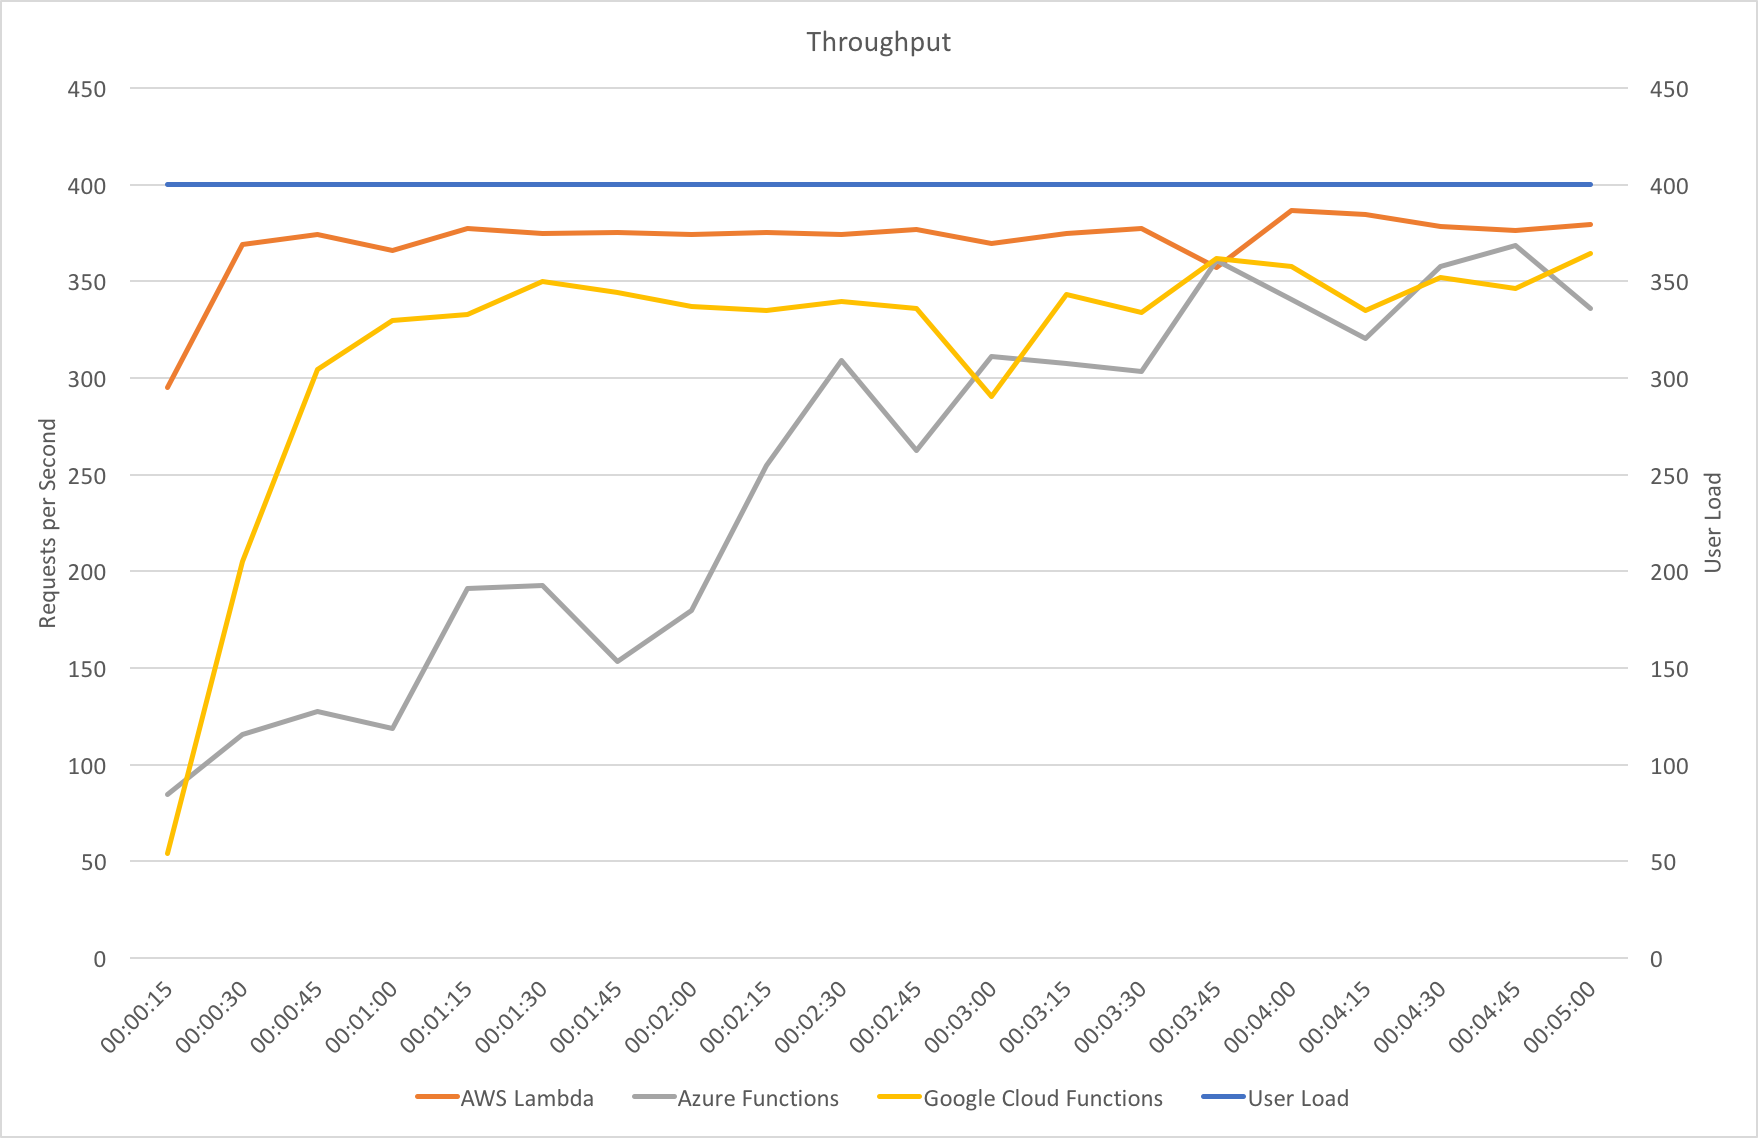
From a throughput perspective the story is largely the same with the Consumption Plan taking time to scale up and address the demand but ultimately proving more capable than even the 4x S1 instance configuration and knocking on the door of AWS Lambda. What I did find particularly notable is the low impact of moving from 2 to 4 instances on throughput – the improvement in throughput is massively disappointing – for incurring twice the cost we are barely getting 50% more throughput. I have insufficient data to understand why this is happening but do have some tests in mind that, time allowing, I will run and see if I can provide further information.

At this kind of load (650 million requests per month) from a bang per buck point of view Azure Functions on the Consumption Plan come out strongly compared to App Service instances even if we don’t allowing for quiet periods when Functions would incur less cost. If your scale profile falls within the capabilities of the service it’s worth considering though it’s worth remembering their isn’t really an SLA around Functions at the moment when running on the Consumption Plan (and to be fair the same applies to AWS Lambda).

If you don’t want to take advantage of any of the additional features that come with a dedicated App Service plan and although they can be provisioned to avoid the slow ramp up of the Consumption Plan are expensive in comparison.

Azure Functions vs AWS Lambda vs Google Cloud Functions – JavaScript Scaling Face Off

Since I published this piece Microsoft have made significant improvements to HTTP scaling on Azure Functions and the below is out of date. Please see this post for a revised comparison.

I had a lot of interesting conversations and feedback following my recent post on scaling a serverless .NET application with Azure Functions and AWS Lambda. A common request was to also include Google Cloud Functions and a common comment was that the runtimes were not the same: .NET Core on AWS Lambda and .NET 4.6 on Azure Functions. In regard to the latter point I certainly agree this is not ideal but continue to contend that as these are your options for .NET and are fully supported and stated as scalable serverless runtimes by each vendor its worth understanding and comparing these platforms as that is your choice as a .NET developer. I’m also fairly sure that although the different runtimes might make a difference to outright raw response time, and therefore throughput and the ultimate amount of resource required, the scaling issues with Azure had less to do with the runtime and more to do with the surrounding serverless implementation.

Do I think a .NET Core function in a well architected serverless host will outperform a .NET Framework based function in a well architected serverless host? Yes. Do I think .NET Framework is the root cause of the scaling issues on Azure? No. In my view AWS Lambda currently has a superior way of managing HTTP triggered functions when compared to Azure and Azure is hampered by a model based around App Service plans.

Taking all that on board and wanting to better evidence or refute my belief that the scaling issues are more host than framework related I’ve rewritten the test subject as a tiny Node / JavaScript application and retested the platforms on this runtime – Node is supported by all three platforms and all three platforms are currently running Node JS 6.x.

My primary test continues to be a mixed light workload of CPU and IO (load three blobs from the vendors storage offering and then compile and run a handlebars template), the kind of workload its fairly typical to find in a HTTP function / public facing API. However I’ve also run some tests against “stock” functions – the vendor samples that simply return strings. Finally I’ve also included some percentile based data which I obtained using Apache Benchmark and I’ve covered off cold start scenarios.

I’ve also managed to normalise the axes this time round for a clearer comparison and the code and data can all be found on GitHub:

https://github.com/JamesRandall/serverlessJsScalingComparison

(In the last week AWS have also added full support for .NET Core 2.0 on Lambda – expect some data on that soon)

Gradual Ramp Up

This test case starts with 1 user and adds 2 users per second up to a maximum of 500 concurrent users to demonstrate a slow and steady increase in load.

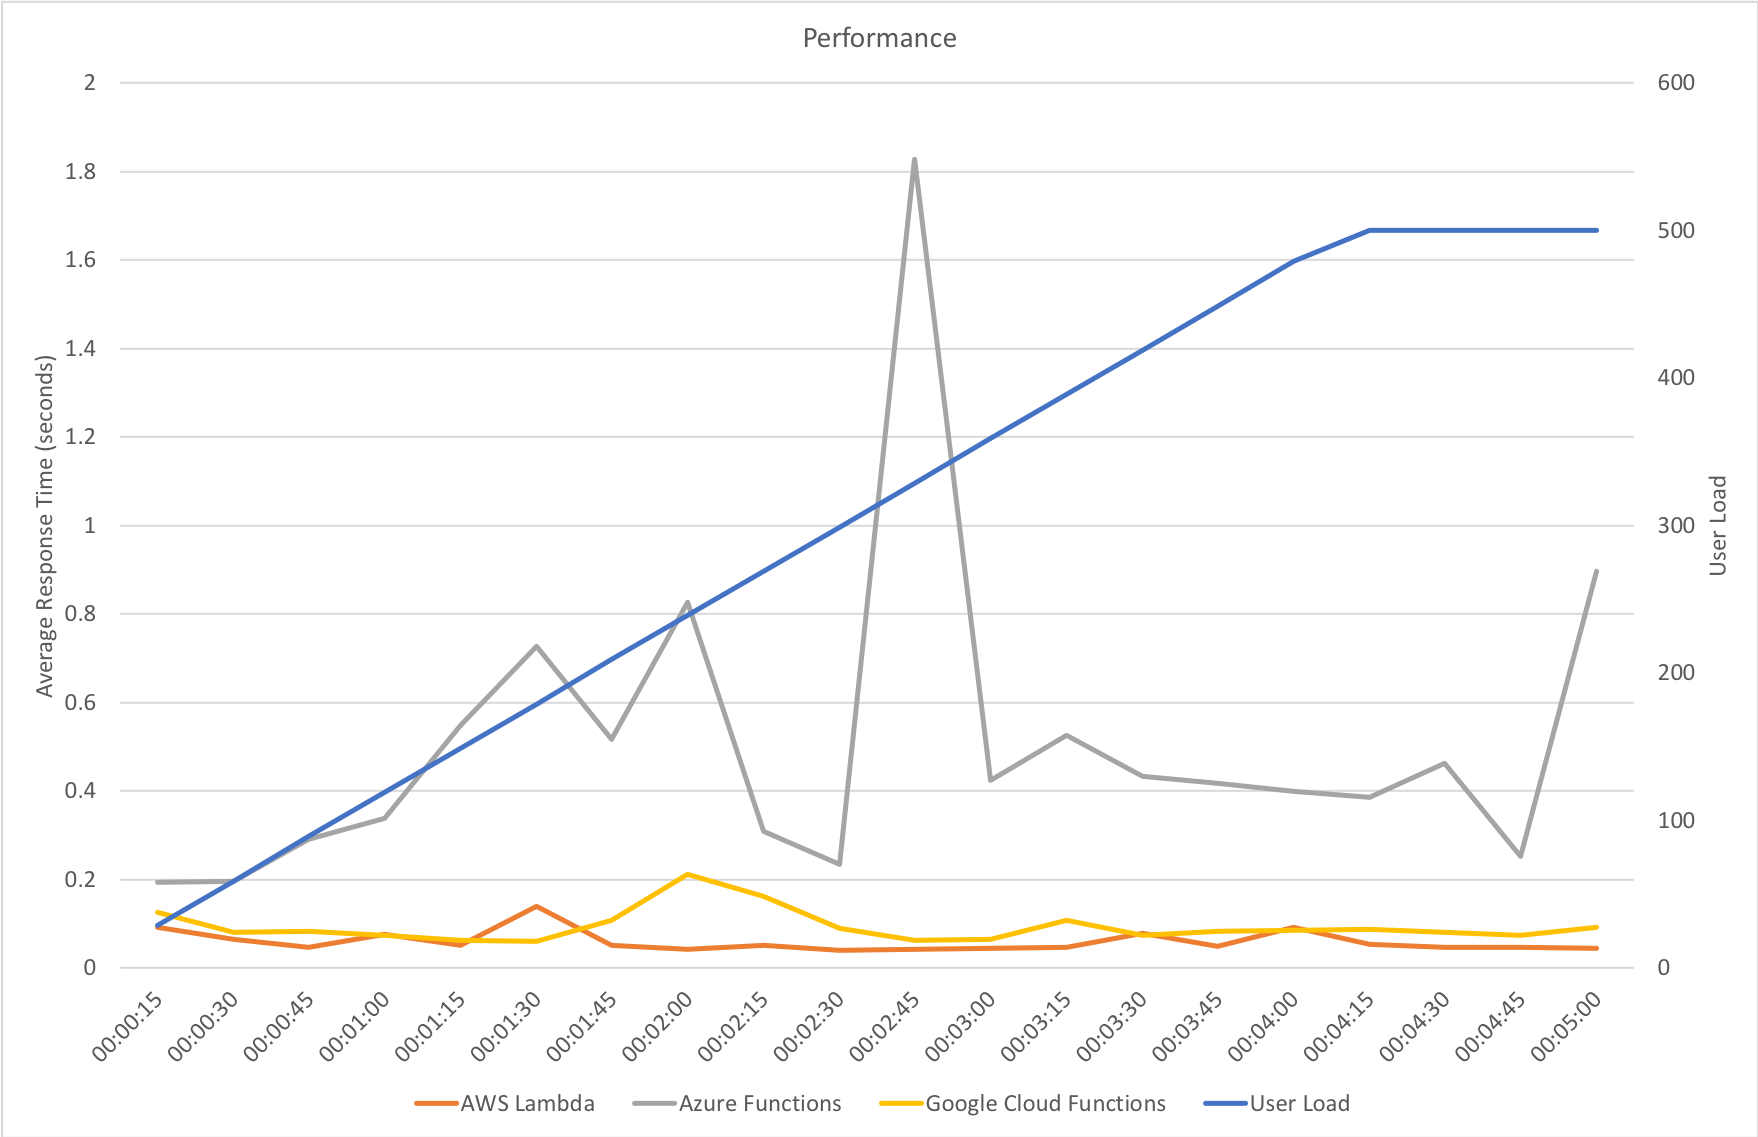
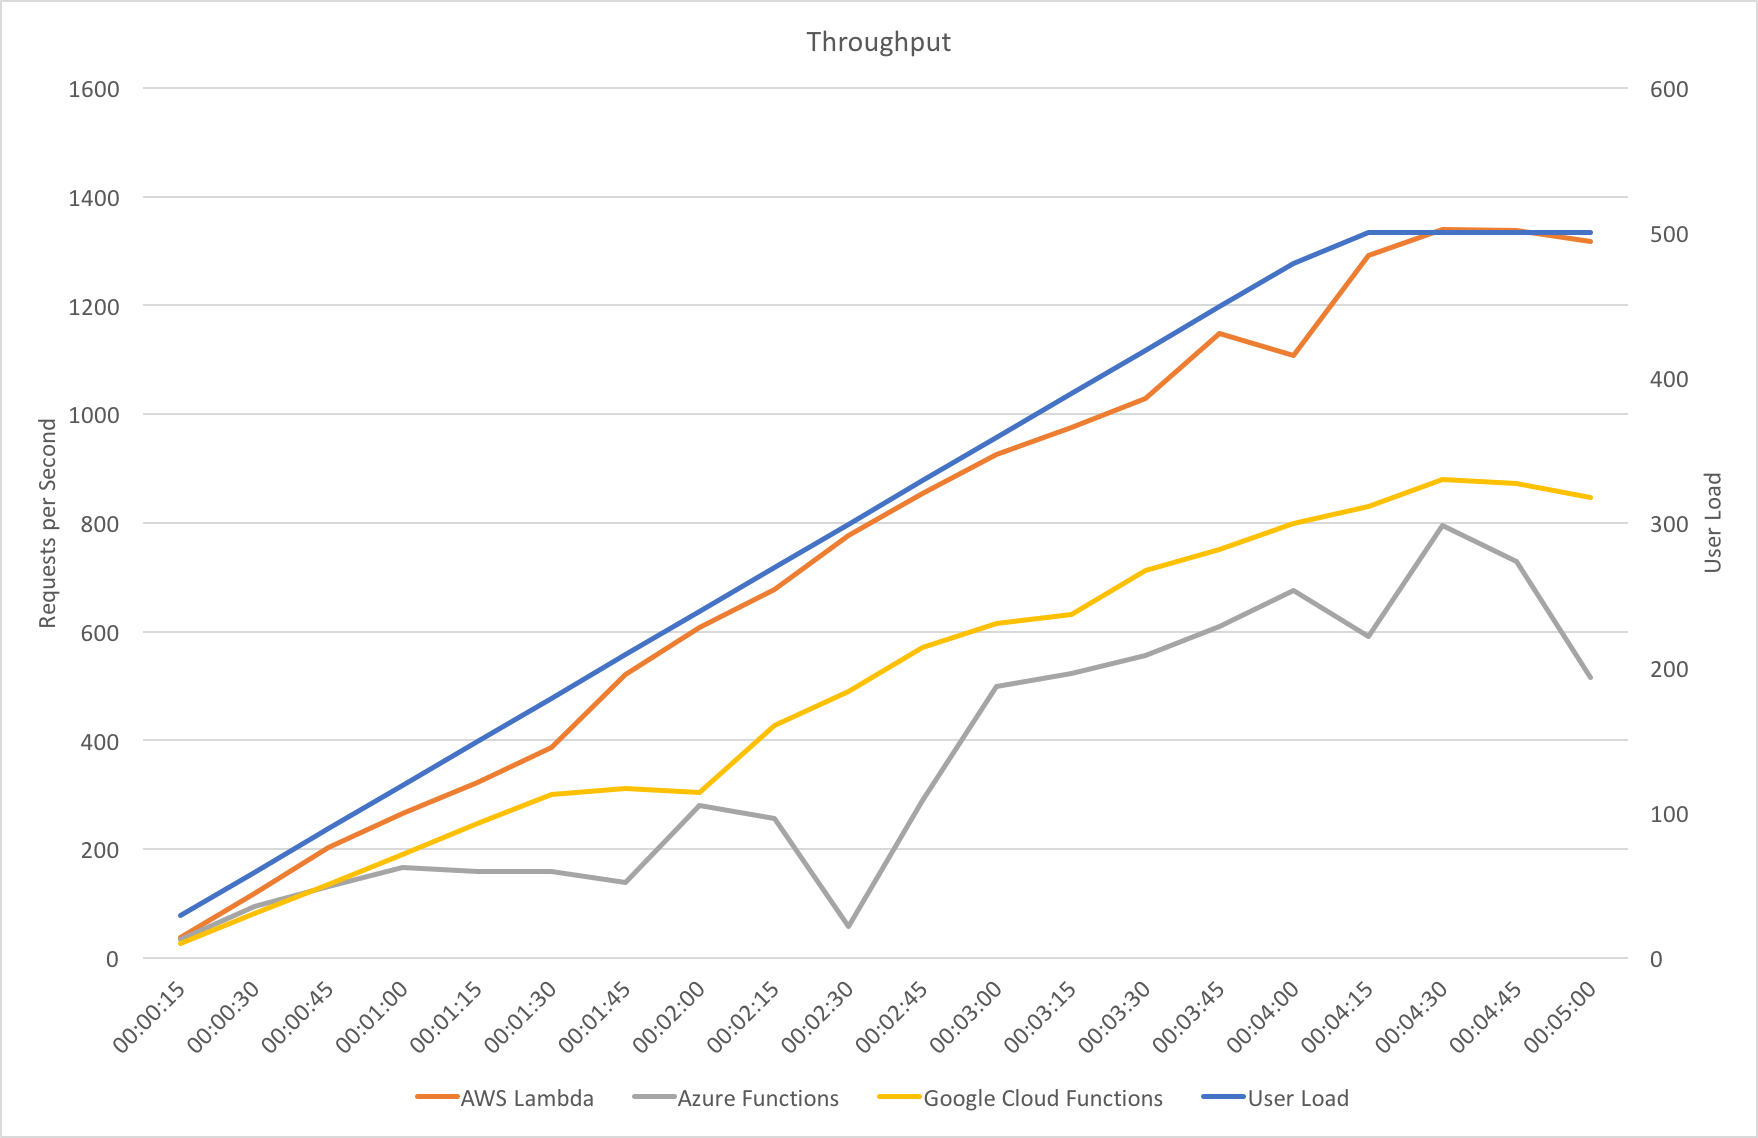
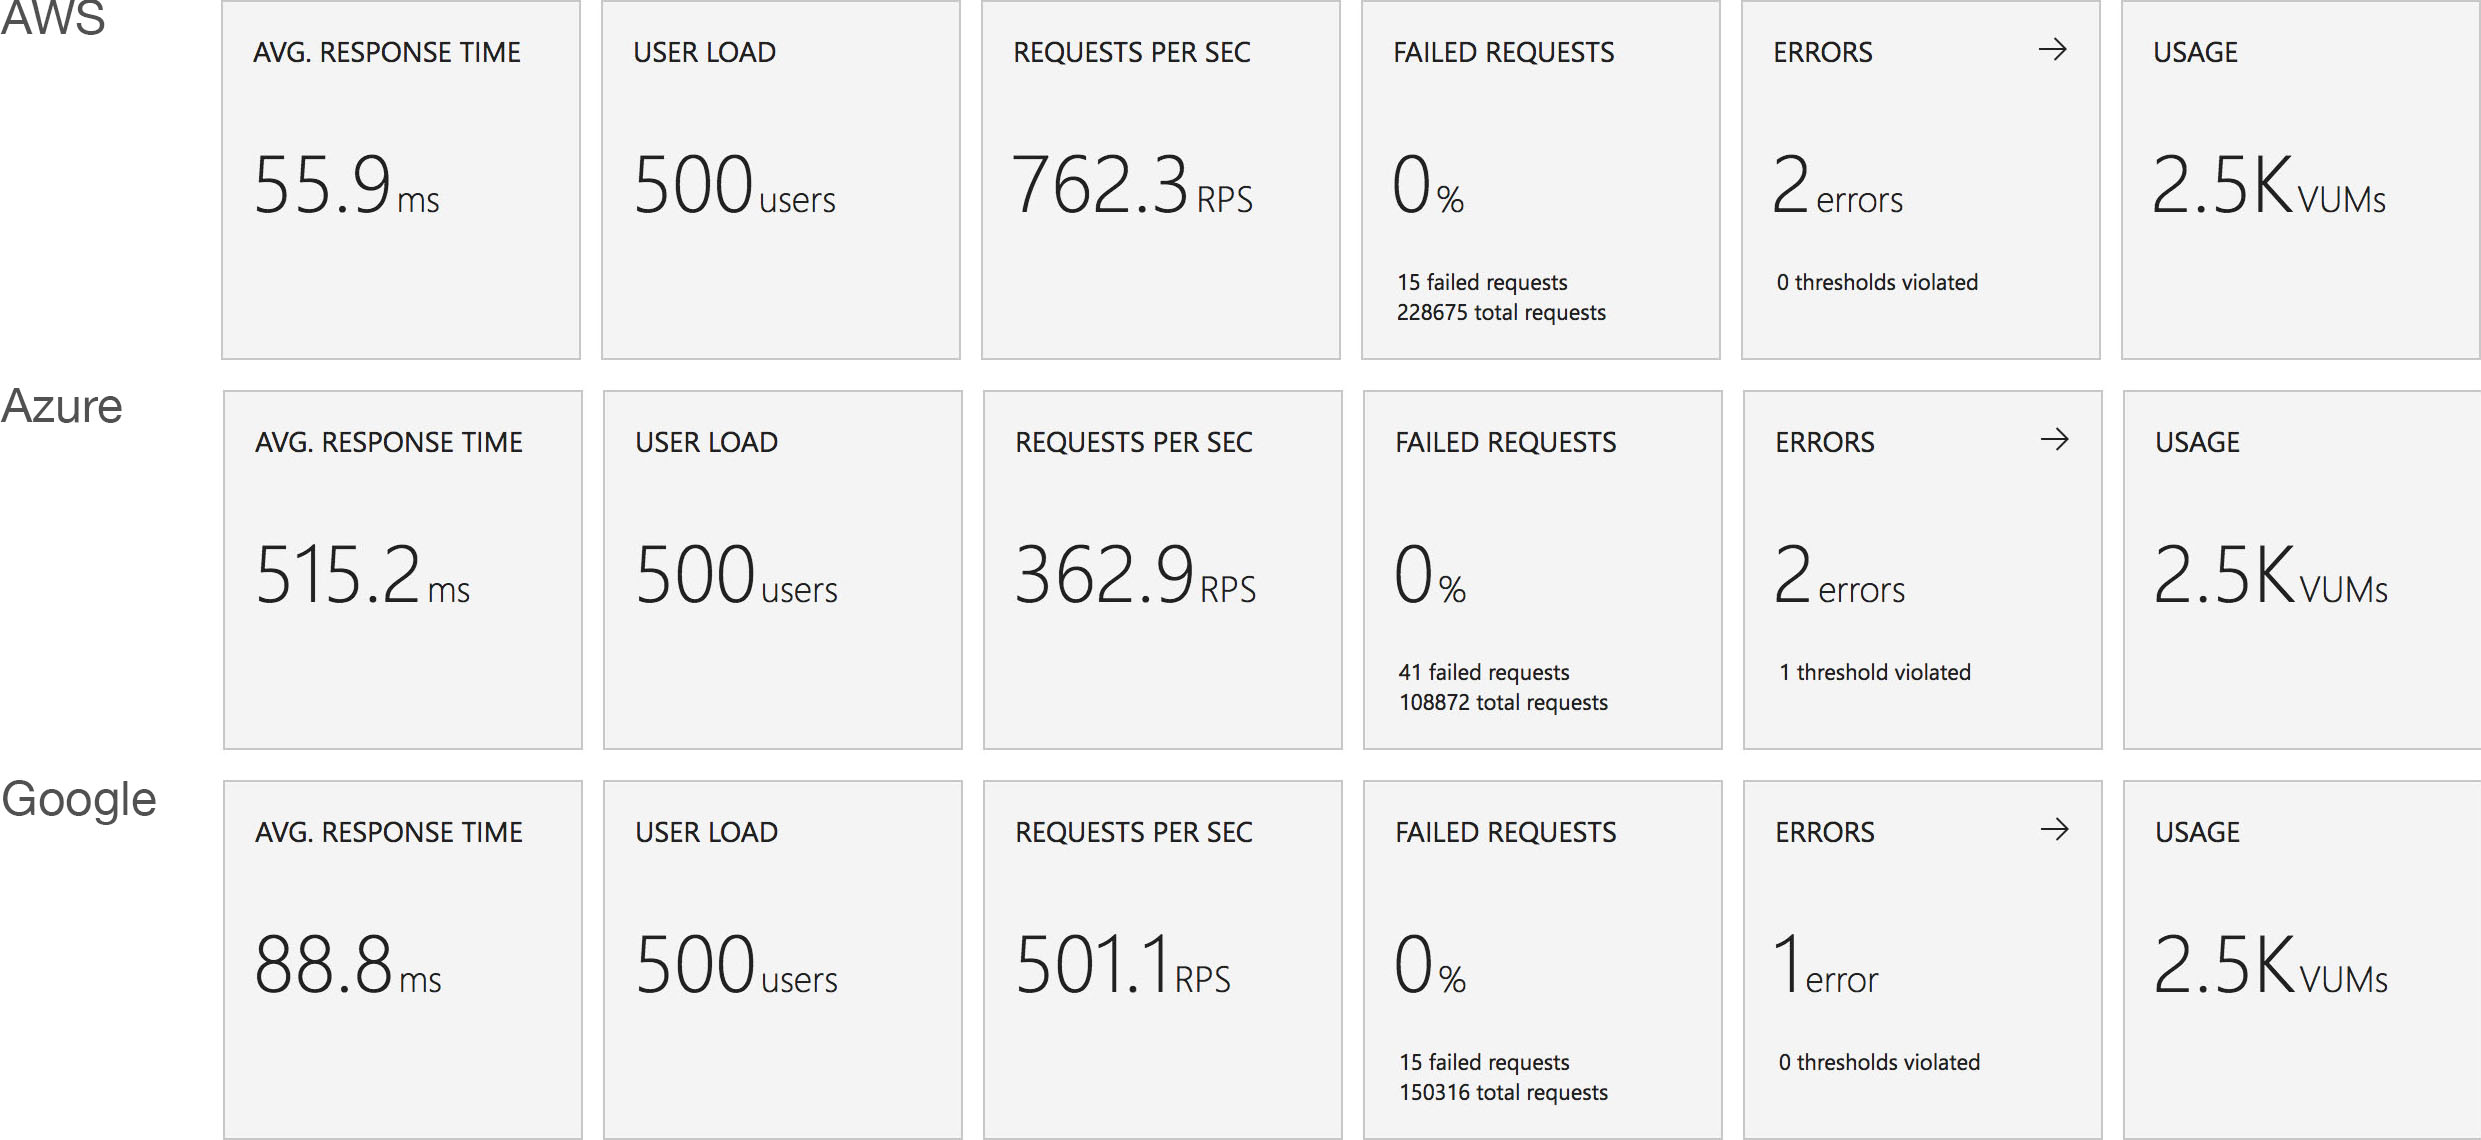
The AWS and Azure results for JavaScript are very similar to those seen for .NET with Azure again struggling with response times and never really competing with AWS when under load. Both AWS and Azure exhibit faster response times when using JavaScript than .NET.

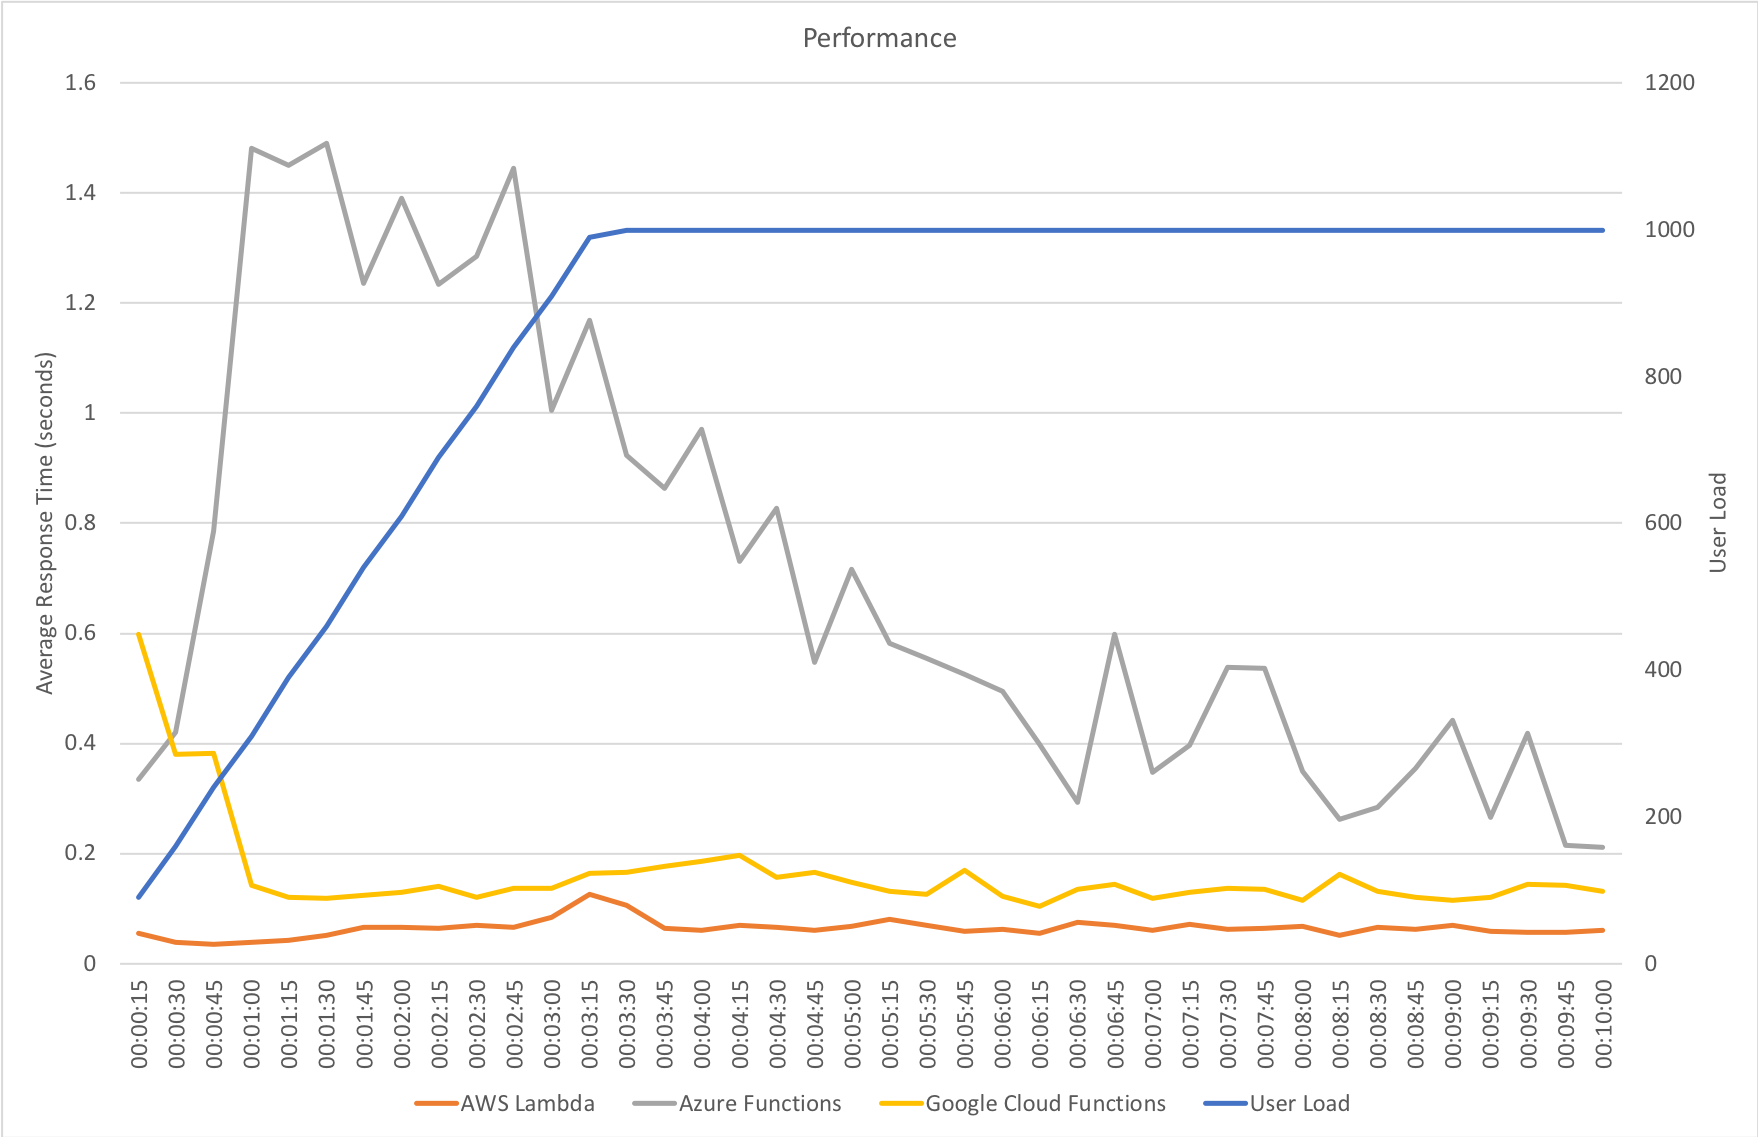
Google Cloud Functions run fairly close to AWS Lambda but can’t quite match it for response time and fall behinds on overall throughput where it sits closer to Azure’s results. Given the difference in response time this would suggest Azure is processing more concurrent incoming requests than Google allowing it to have a similar throughput after the dip Azure encounters at around the 2:30 mark – presumably Azure allocates more resource at that point. That dip deserves further attention and is something I will come back to in a future post.

Rapid Ramp Up

This test case starts with 10 users and adds 10 users every 2 seconds up to a maximum of 1000 concurrent users to demonstrate a more rapid increase in load and a higher peak concurrency.

Again AWS handles the increase in load very smoothly maintaining a low response time throughout and is the clear leader.

Azure struggles to keep up with this rate of request increase. Response times hover around the 1.5 second mark throughout the growth stage and gradually decrease towards something acceptable over the next 3 minutes. Throughput continues to climb over the full duration of the test run matching and perhaps slightly exceeding Google by the end but still some way behind Amazon.

Google has two quite distinctively sharp drops in response time early on in the growth stageas the load increases before quickly stabilising with a response time around 140ms and levels off with throughput in line with the demand at the end of the growth phase.

I didn’t run this test with .NET, instead hitting the systems with an immediate 1000 users, but nevertheless the results are inline with that test particularly once the growth phase is over.

Immediate High Demand

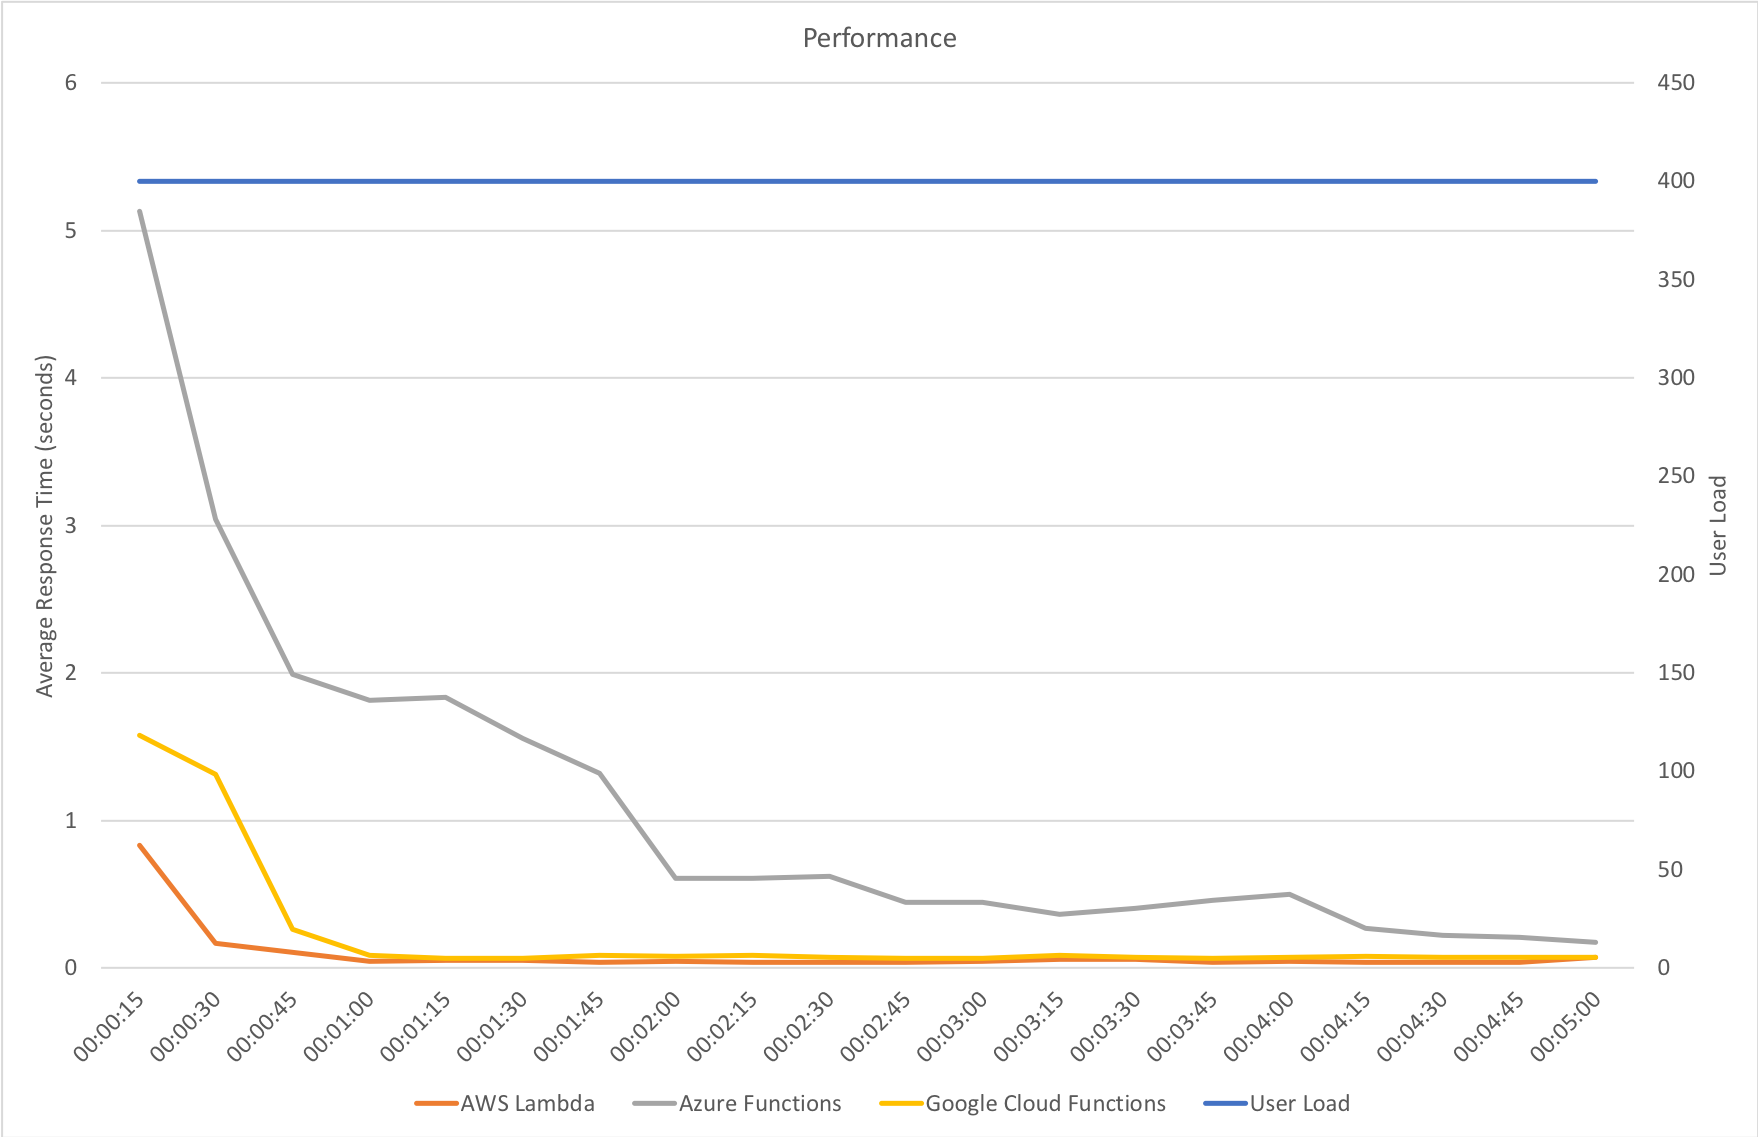
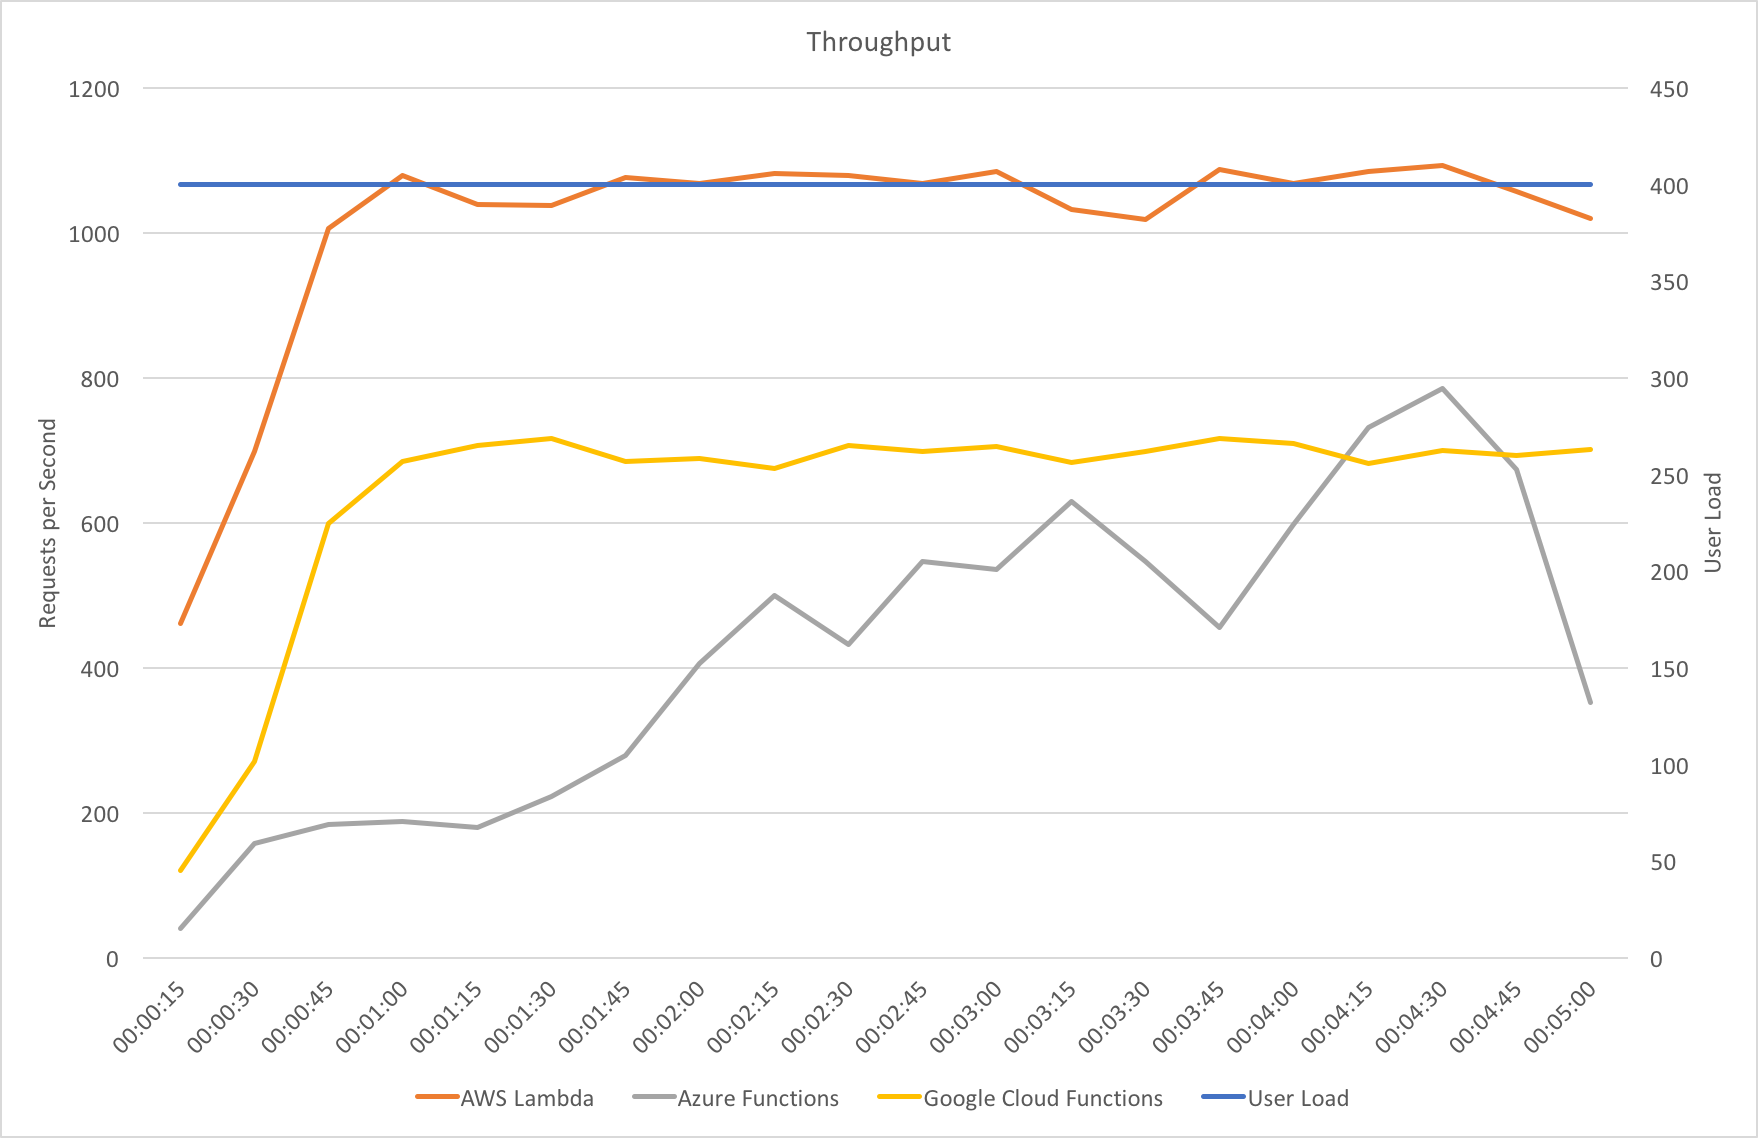
This test case starts immediately with 400 concurrent users and stays at that level of load for 5 minutes demonstrating the response to a sudden spike in demand.

Both AWS and Google scale quickly to deal with the sudden demand both hitting a steady and low response time around the 1 minute mark but AWS is a clear leader in throughput – it is able to get through many more requests per second than Google due to its lower response time.

Azure again brings up the rear – it takes nearly 2 minutes to reach a steady response time that is markedly higher than both Google and AWS. Throughput continues to increase to the end of the test where it eventually peaks slightly ahead of Google but still some way behind AWS. It then experiences a fall off which is difficult to explain from the data available.

Stock Functions

This test uses the stock “return a string” function provided by each platform (I’ve captured the code in GitHub for reference) with the immediate high demand scenario: 400 concurrent users for 5 minutes.

With the functions essentially doing no work and no IO the response times are, as you would expect, smaller across the board but the scaling patterns are essentially unchanged from the workload function under the same load. AWS and Google respond quickly while Azure ramps up more slowly over time.

Percentile Performance

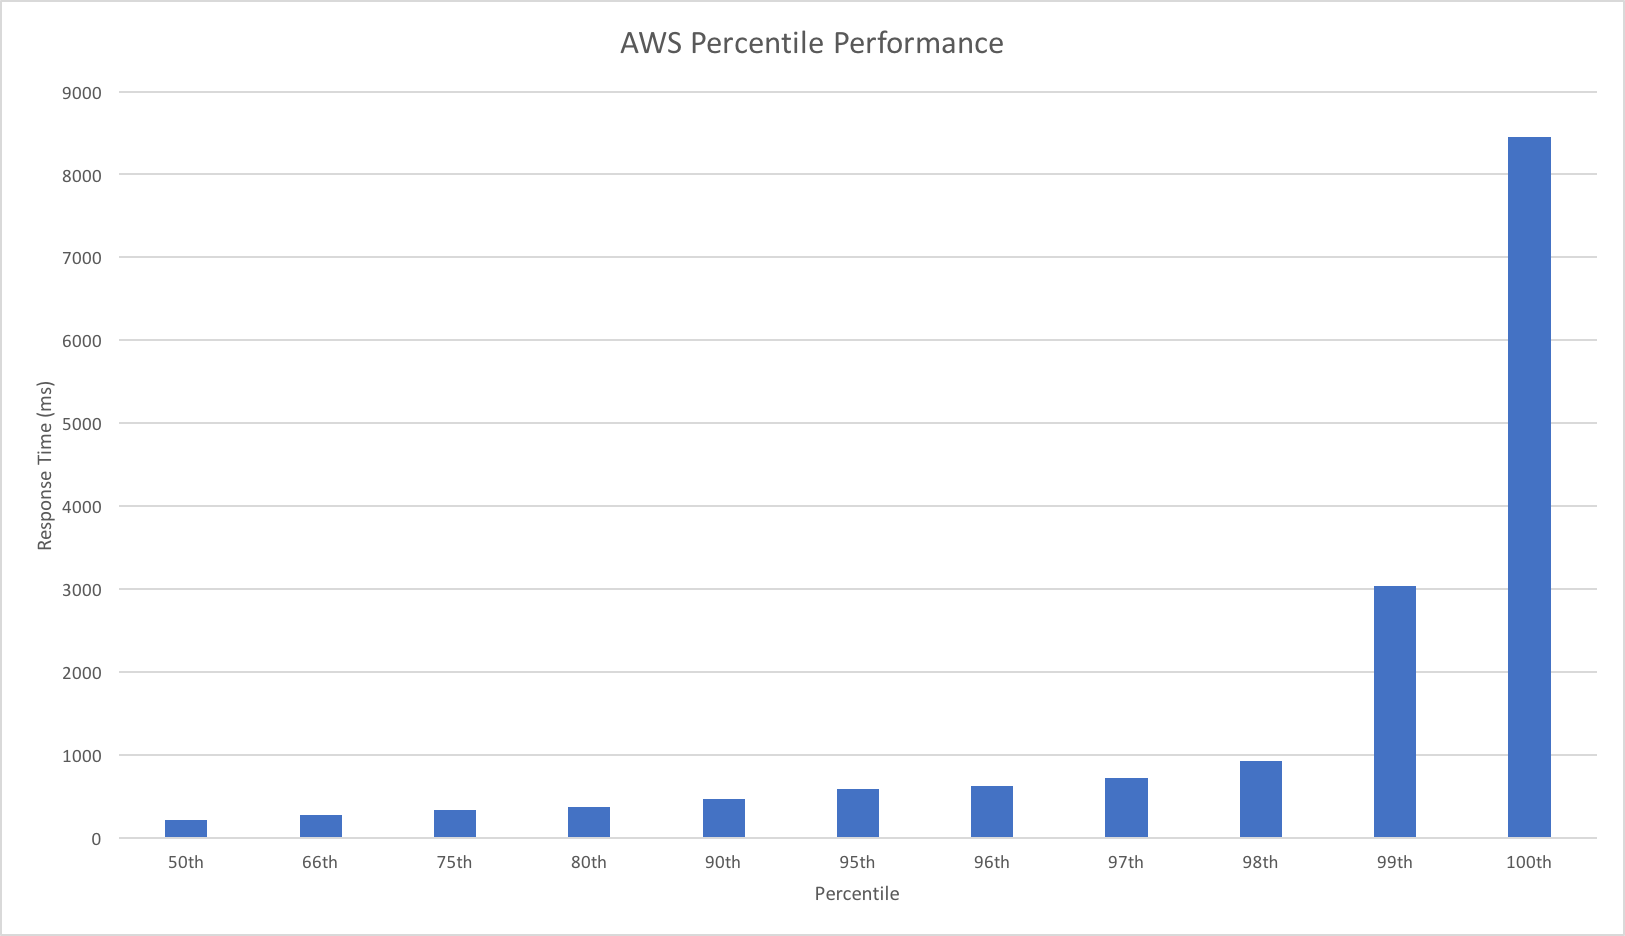
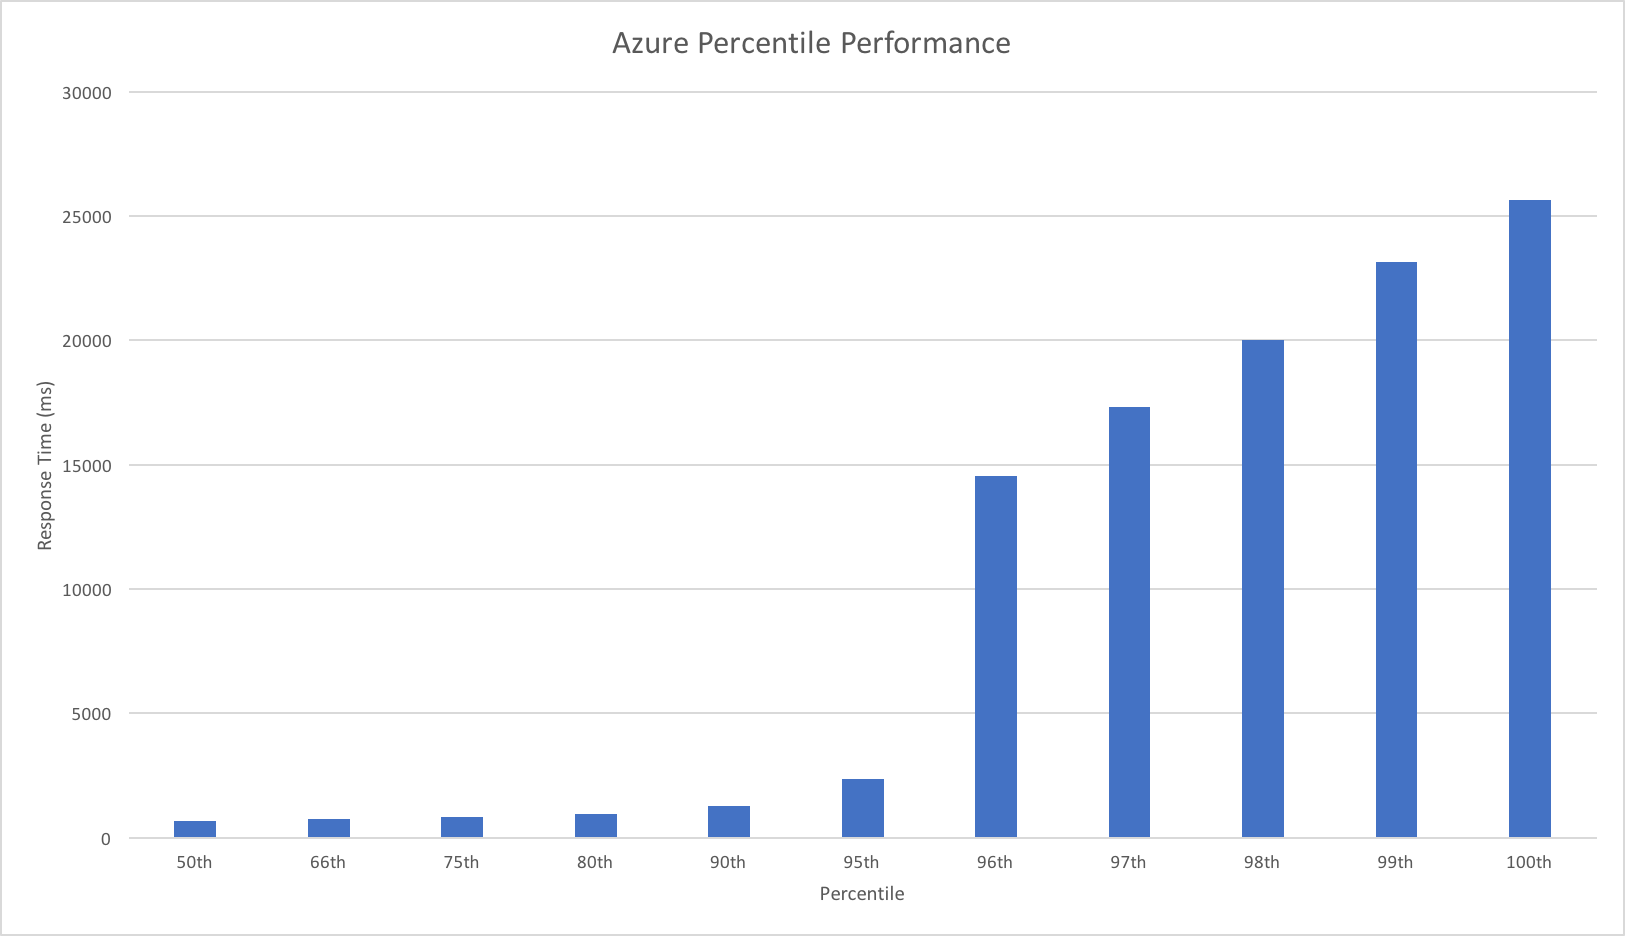
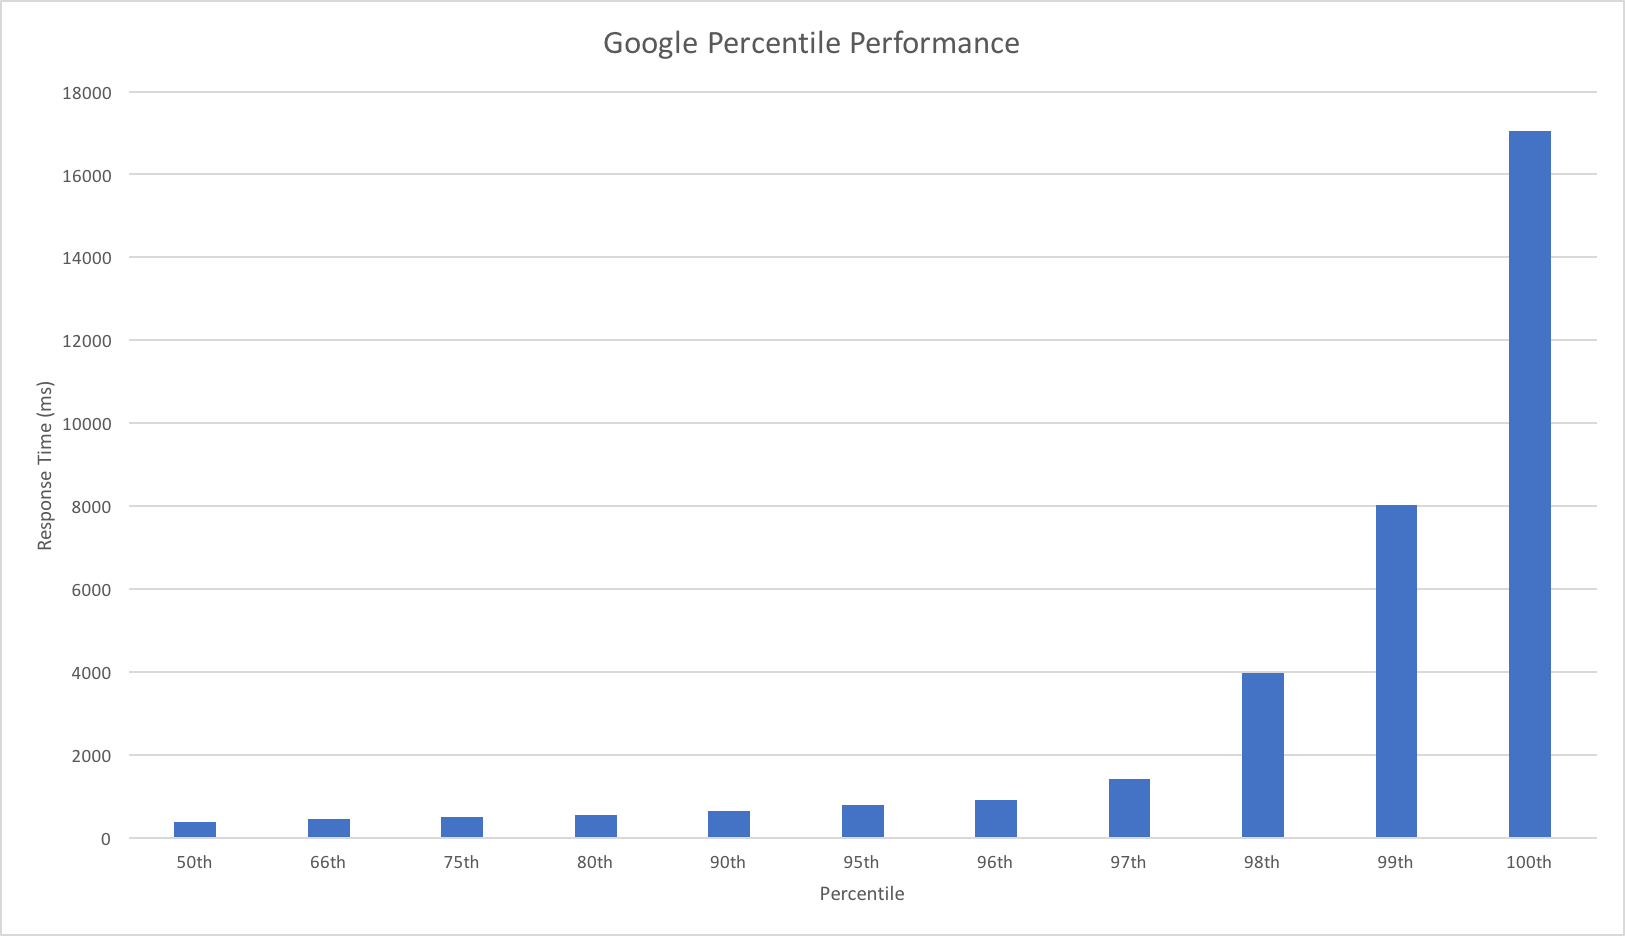
I was unable to obtain this data from VSTS and so resorted to running Apache Benchmarker. For this test I used settings of 100 concurrent requests for a total of 10000 requests, collected the raw data, and processed it in Excel. It should be noted that the network conditions were less predictable for these tests and I wasn’t always as geographically close to the cloud function as I was in other tests though repeated runs yielded similar patterns:

AWS maintains a pretty steady response time up to and including the 98th percentile but then shows marked dips in performance in the 99th and 100th percentiles with a worst case of around 8.5 seconds.

Google dips in performance after the 97th percentile with it’s 99th percentile roughly equivalent to AWSs 100th percentile and it’s own 100th percentile being twice as slow.

Azure exhibits a significant dip in performance at the 96th percentile with a sudden drop in response time from a not great 2.5 seconds to 14.5 seconds – in AWSs 100th percentile territory. Beyond the 96th percentile their is a fairly steady decrease in performance of around 2.5 seconds per percentile.

Cold Starts

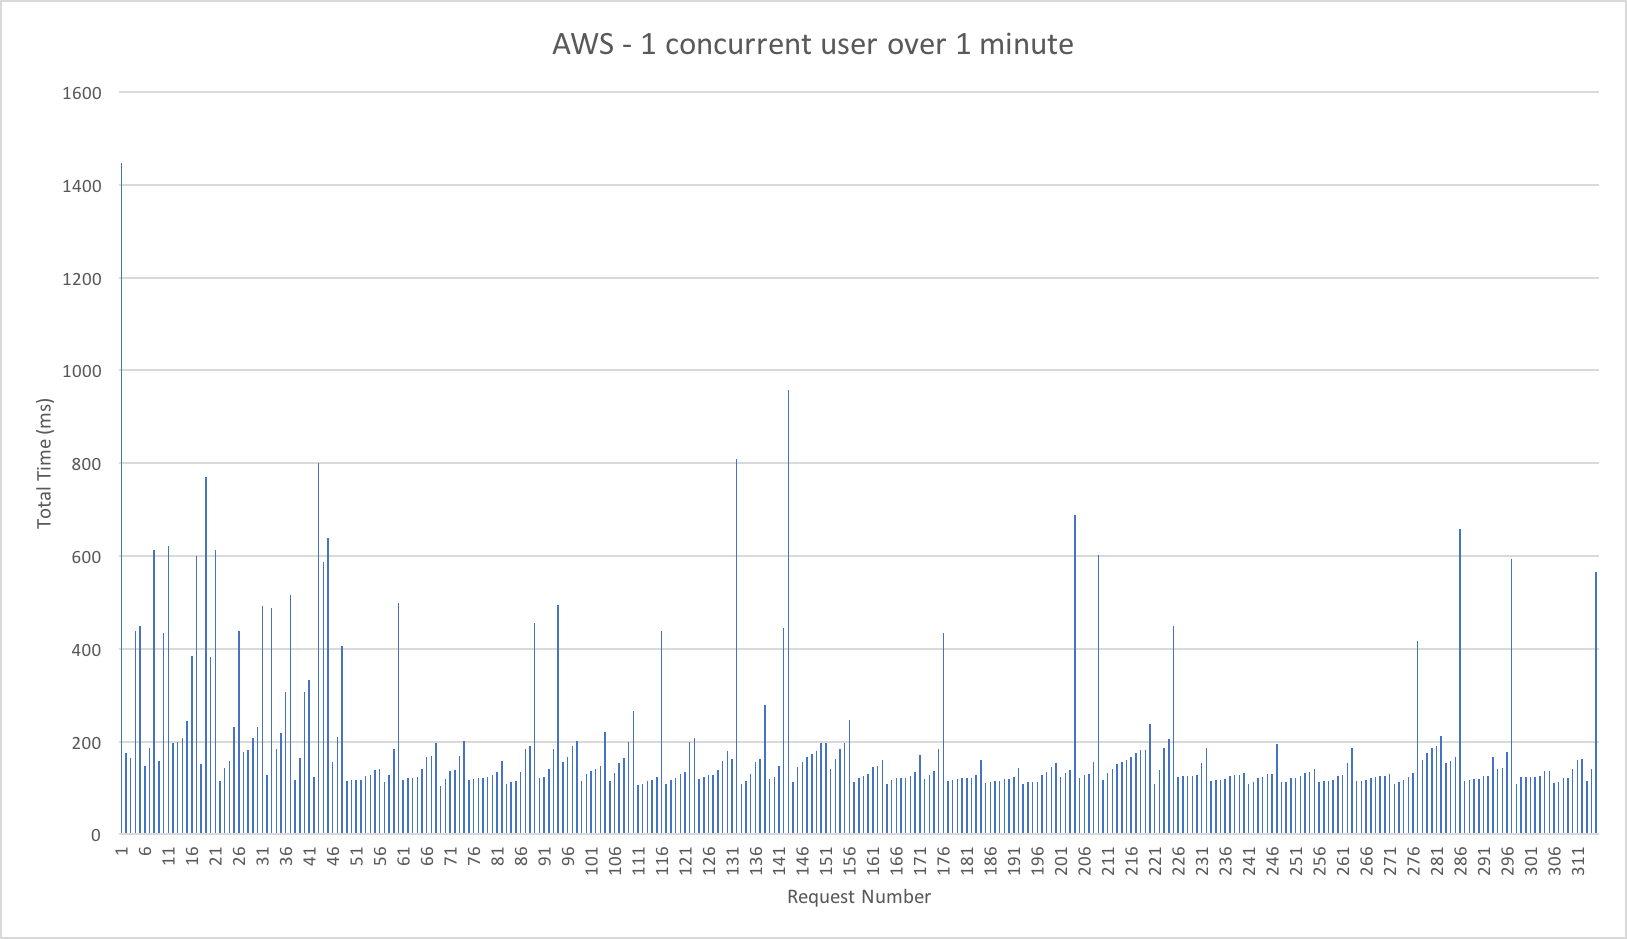
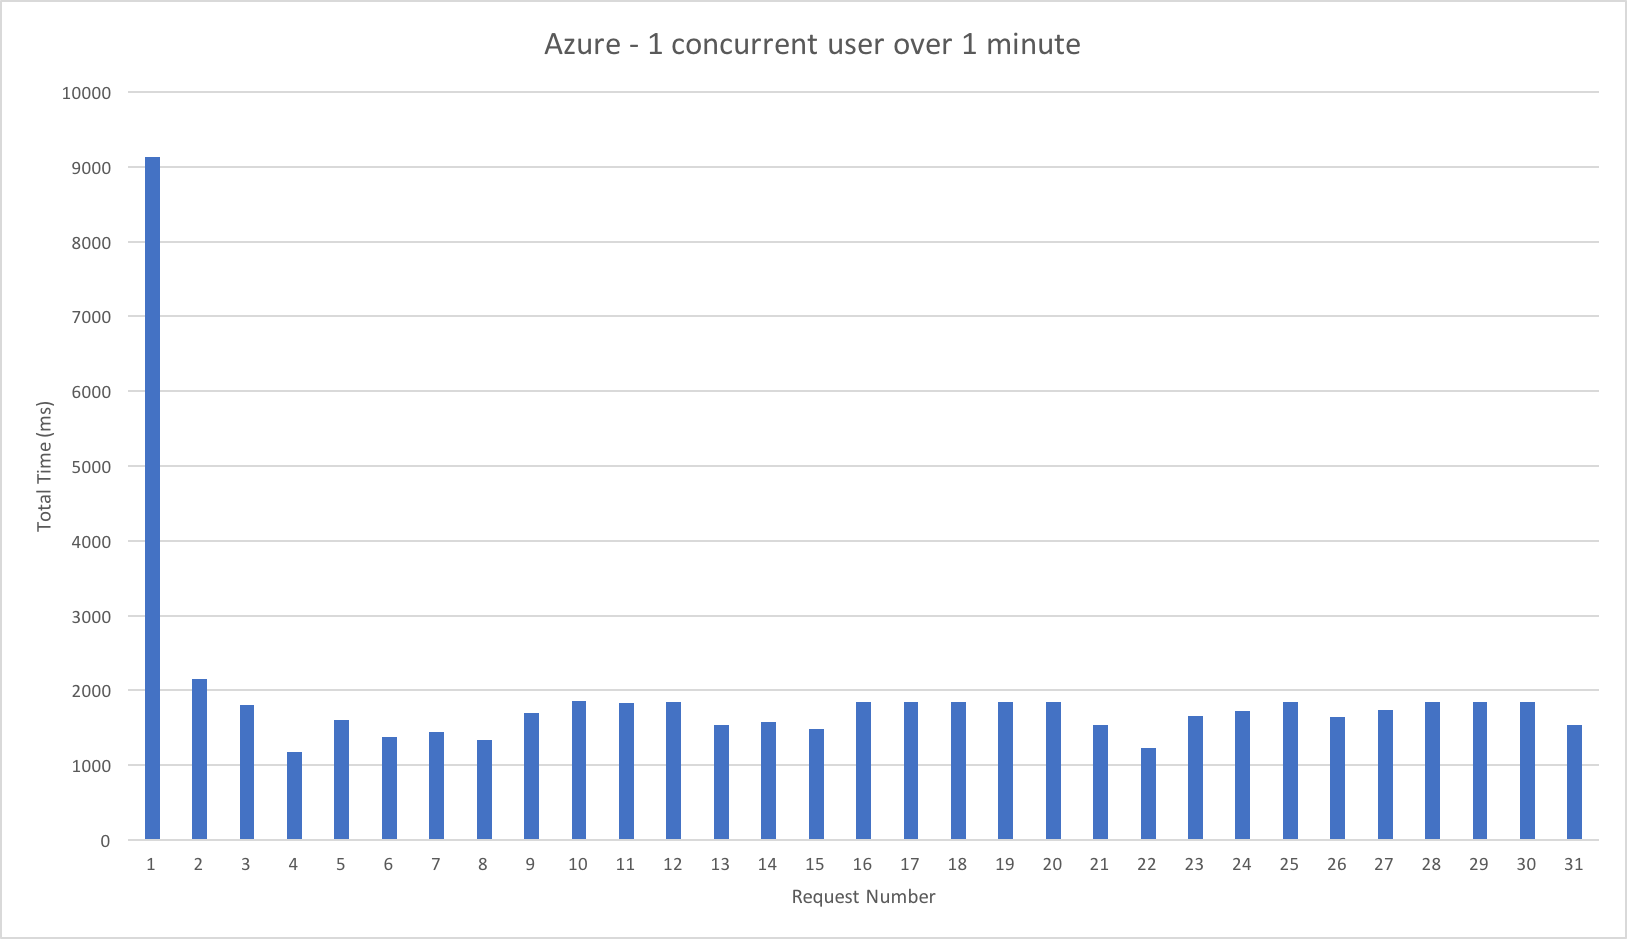
All the vendors solutions go “cold” after a time leading to a delay when they start. To get a sense for this I left each vendor idle overnight and then had 1 user make repeat requests for 1 minute to illustrate the cold start time but also get a visual sense of request rate and variance in response time:

Again we have some quite striking results. AWS has the lowest cold start time of around 1.5 seconds, Google is next at 2.5 seconds and Azure again the worst performer at 9 seconds. All three systems then settle into a fairly consistent response time but it’s striking in these graphs how AWS Lambda’s significantly better performance translates into nearly 3x as many requests as Google and 10x more requests than Azure over the minute.

It’s worth noting that the cold start time for the stock functions is almost exactly the same as for my main test case – the startup is function related and not connected to storage IO.

Conclusions

AWS Lambda is the clear leader for HTTP triggered functions – on all the runtimes I’ve tried it has the lowest response times and, at least within the volumes tested, the best ability to deal with scale and the most consistent performance. Google Cloud Functions are not far behind and it will be interesting to see if they can close the gap with optimisation work over the coming year – if they can get their flat our response times reduced they will probably pull level with AWS. The results are similar enough in their characteristics that my suspicion is Google and AWS have similar underlying approaches.

Unfortunately, like with the .NET scenarios, Azure is poor at handling HTTP triggered functions with very similar patterns on show. The Azure issues are not framework based but due to how they are hosting functions and handling scale. Hopefully over the next few months we’ll see some improvements that make Azure a more viable host for HTTP serverless / API approaches when latency matters.

By all means use the above as a rough guide but ultimately whatever platform you choose I’d encourage you to build out the smallest representative vertical slice of functionality you can and test it.

Thanks for reading – hopefully this data is useful.

Azure Functions vs AWS Lambda – Scaling Face Off

Since I published this piece Microsoft have made significant improvements to HTTP scaling on Azure Functions and the below is out of date. Please see this post for a revised comparison.

If you’ve been following my blog recently you’ll know I’ve been spending a lot of time with the Azure Functions – Microsoft’s implementation of a serverless platform. The idea behind serverless appeals to me massively and seems like the natural next evolution of compute on the cloud with scaling and pricing being, so the premise goes, fully dynamic and consumption based.

The use of App Service Plans (more later) as a host mechanism for Azure Functions gave me some concern about how “serverless” Azure Functions might actually be and so to verify suitability for my use cases I’ve been running a range of different tests around response time and latency that culminated in the “real” application I described in my last blog post and some of the performance tests I ran along the way. I quickly learned that the hosting implementation is not particularly dynamic and so wanted to run comparable tests on AWS Lambda.

To do this I’ve ported the serverless blog over to AWS Lambda, S3 and DynamoDB (the, rather scruffy, code is in a branch on GitHub – I will tidy this up but the aim was to get the tests running) and then I’ve run a number of user volume scenarios against a single test case: loading the homepage. The operations involved in this are:

  1. A GET request to a serverless HTTP endpoint that:
    1. Loads 3 resources from storage (Blob Storage on Azure, S3 on AWS) in an asynchronous batch.
    2. Combines them together using a Handlebars template
    3. Returns the response as a string of type text/html.

On Azure I’m using .NET 4.6 on the v1 runtime while on AWS I’m using the same code running under .NET Core 1.0. It’s worth noting that latency on blob access remained minimal throughout all these tests (6ms on average across all loads) and when removing blob access from the tests it made little difference to the patterns.

Although the .NET 4.6 and Core runtimes are different (and accepted may exhibit different behaviours) these are the current general availability options for implementing serverless on the two platforms using .NET and both vendors claim full support for them. In Microsoft’s case some of the languages supported on the v1 Azure Functions runtime, the one tested here (v2 is in preview and has serious performance issues with .NET Core), are experimental and documented as having scale problems but C# (which runs under full framework .NET) is not one of them. Both vendors have .NET Core 2.0 support on the way and in preview but given the issues I’m waiting until they go on general availability until I compare them.

The results are, frankly, pretty damning when it comes to Azure Functions ability to scale dynamically and so let’s get into the data and then look at why.

A quick note on the graphs: I’ve pulled these from VSTS, it’s quite hard (or at least I don’t know how to!) equalise the scales and so please do look at the numbers carefully – the difference is quite startling.

Add 2 Users per Second

In this test scenario I’ve started with a single user and then added 2 users per second over a 5 minutes run time up to a maximum of 500 users:
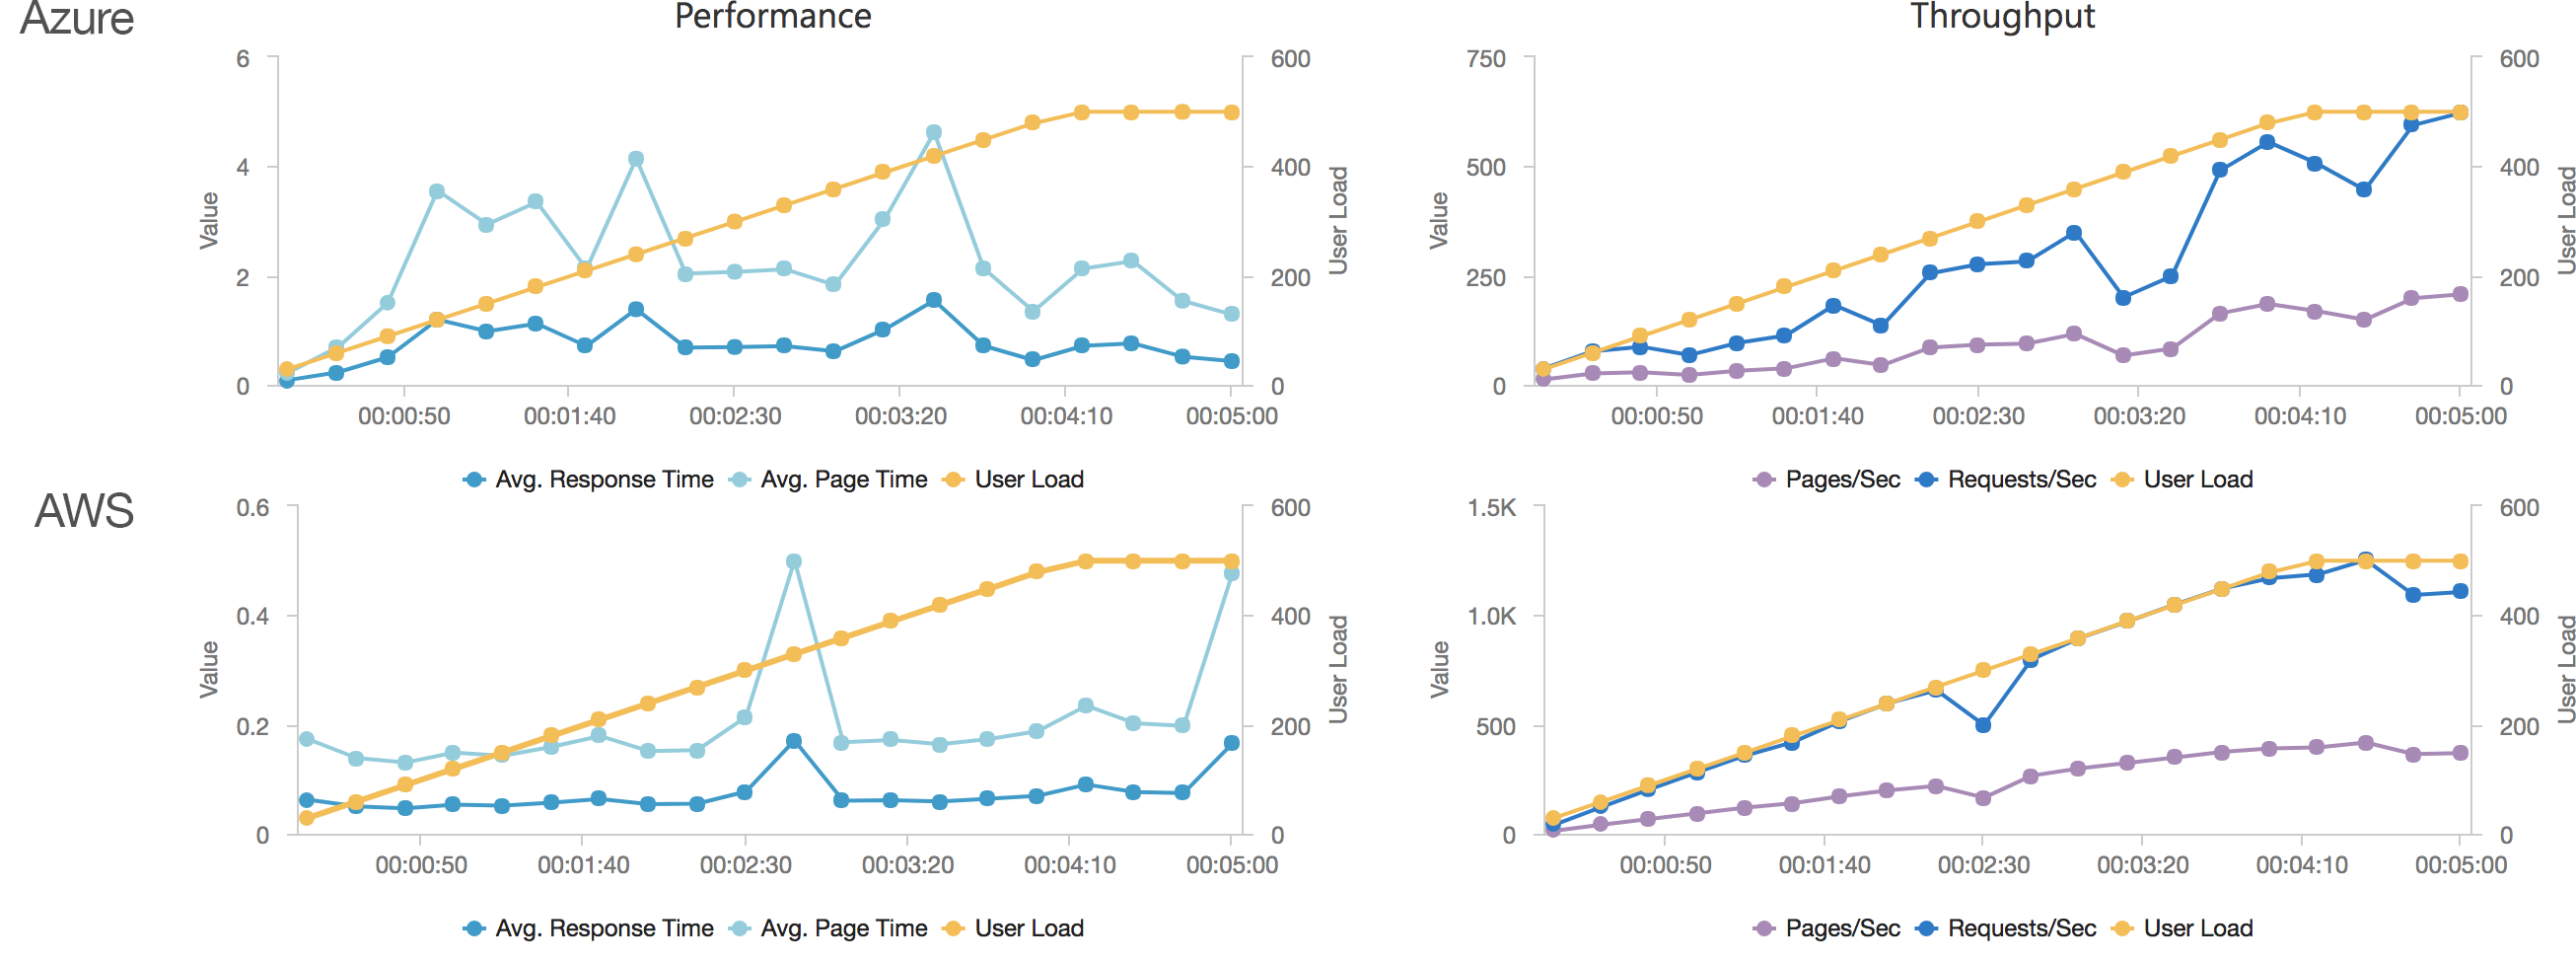
We can see from this test that AWS matches the growth in user load almost exactly, it has no issue dealing with the growing demand and page requests time hover around the 100ms mark. Contrast this with Azure which always lags a little behind the demand, is spikier, and has a much higher response time hovering around the 700ms mark.

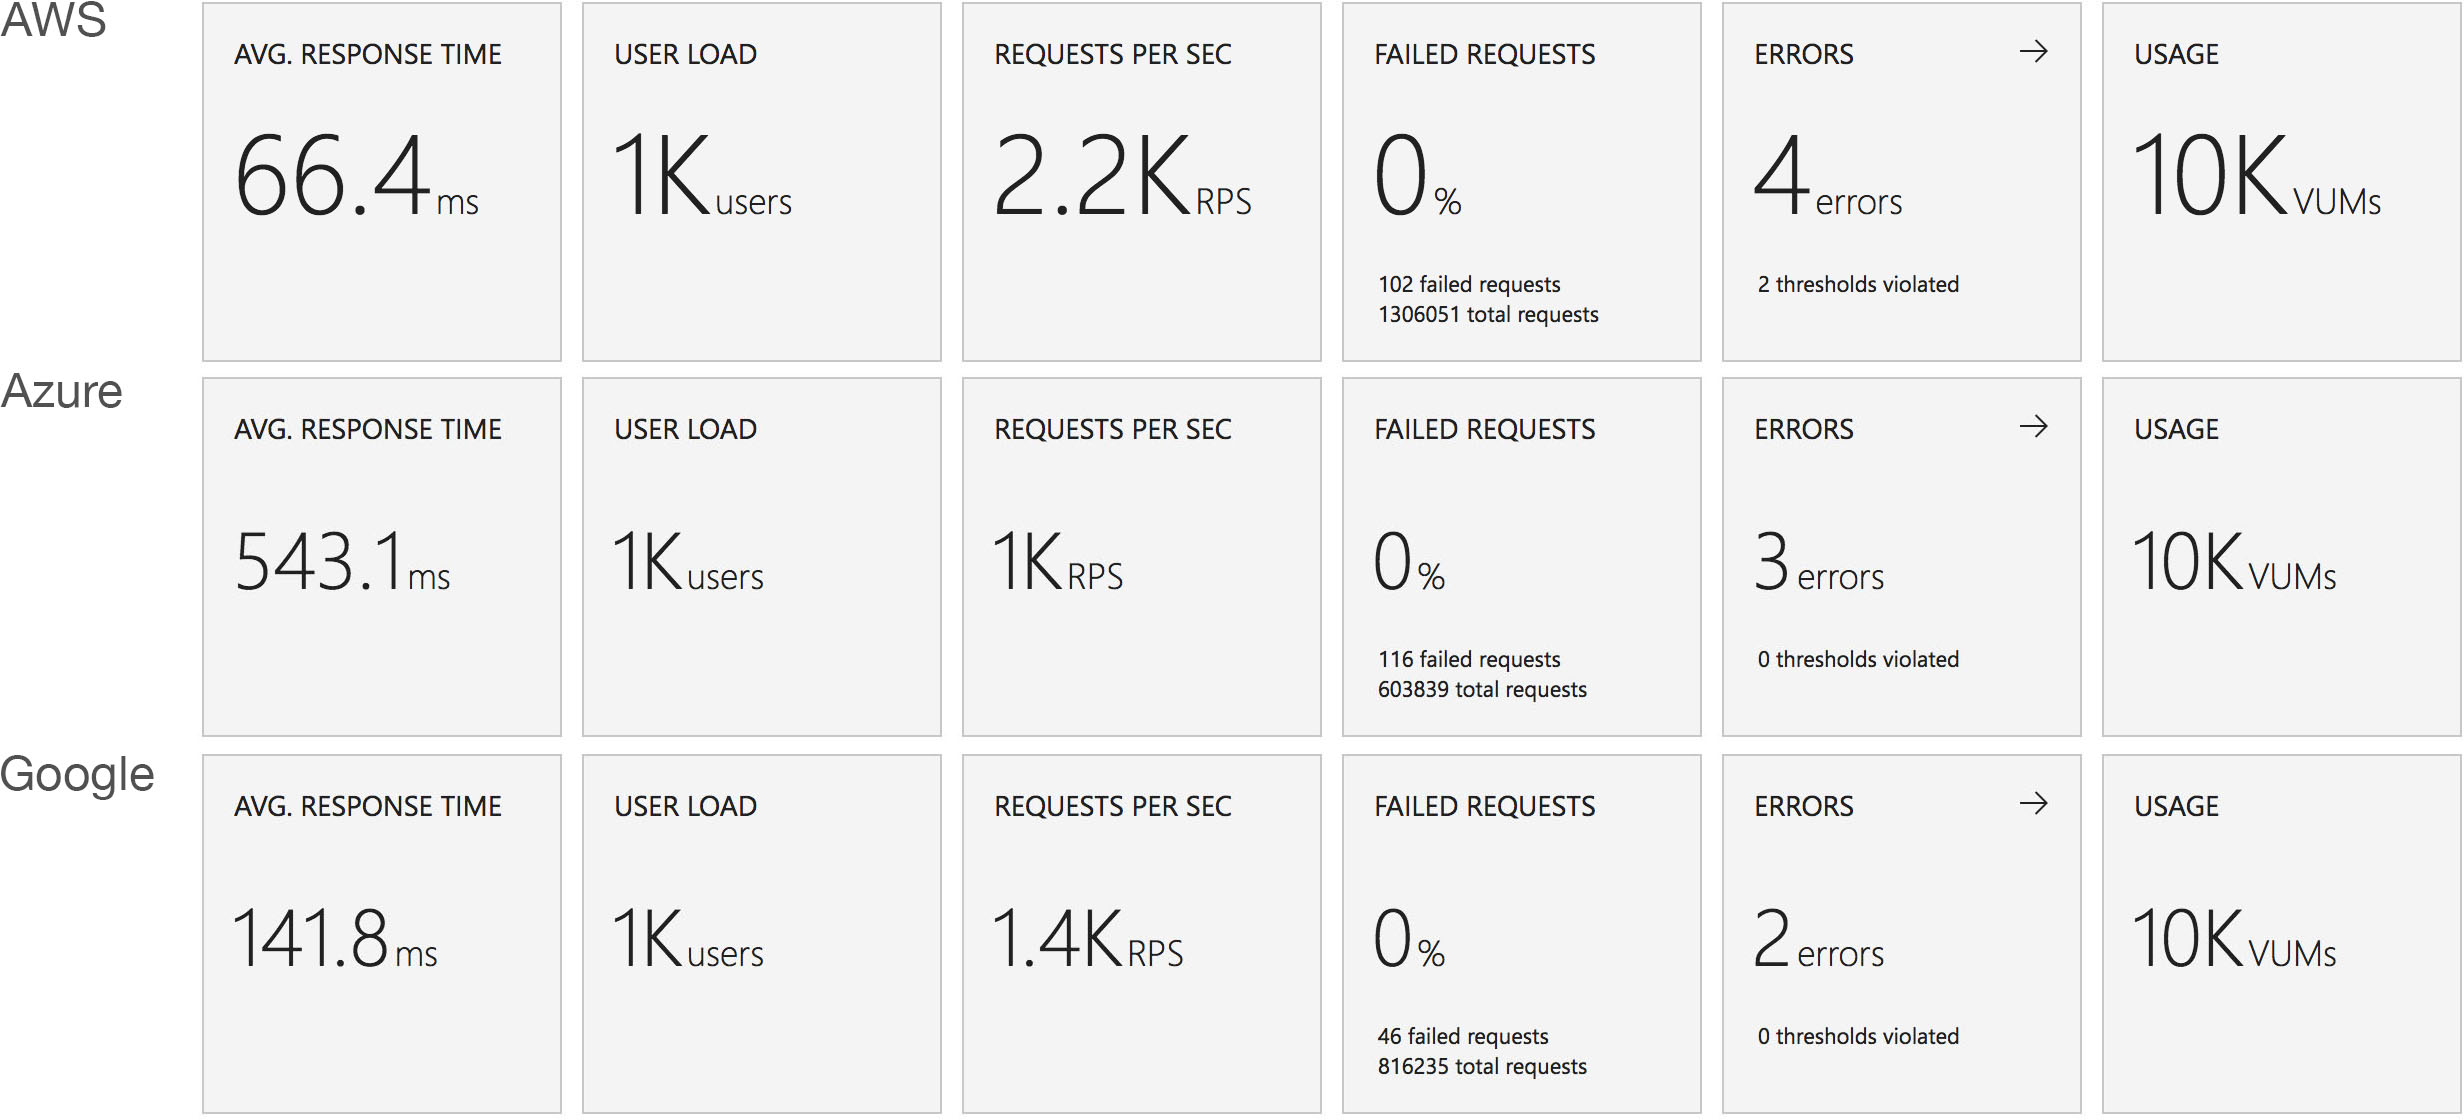
This is backed up by the average stats from the run:

It’s interesting to note just how many more requests AWS dealt with as a result of it’s better performance: 215271 as opposed to Azure’s 84419. Well over twice as many.

Constant Load of 400 Concurrent Users

This test hits the application with 400 concurrent users from a standing start and runs over a 10 minute period simulating a sudden spike or influx of traffic and looking at how quickly each serverless environment is able to deal with the load. Neither environment was completely cold as I’d been refreshing the view in the browser but neither had had any significant traffic for some time. The contrast is significant to say the least:
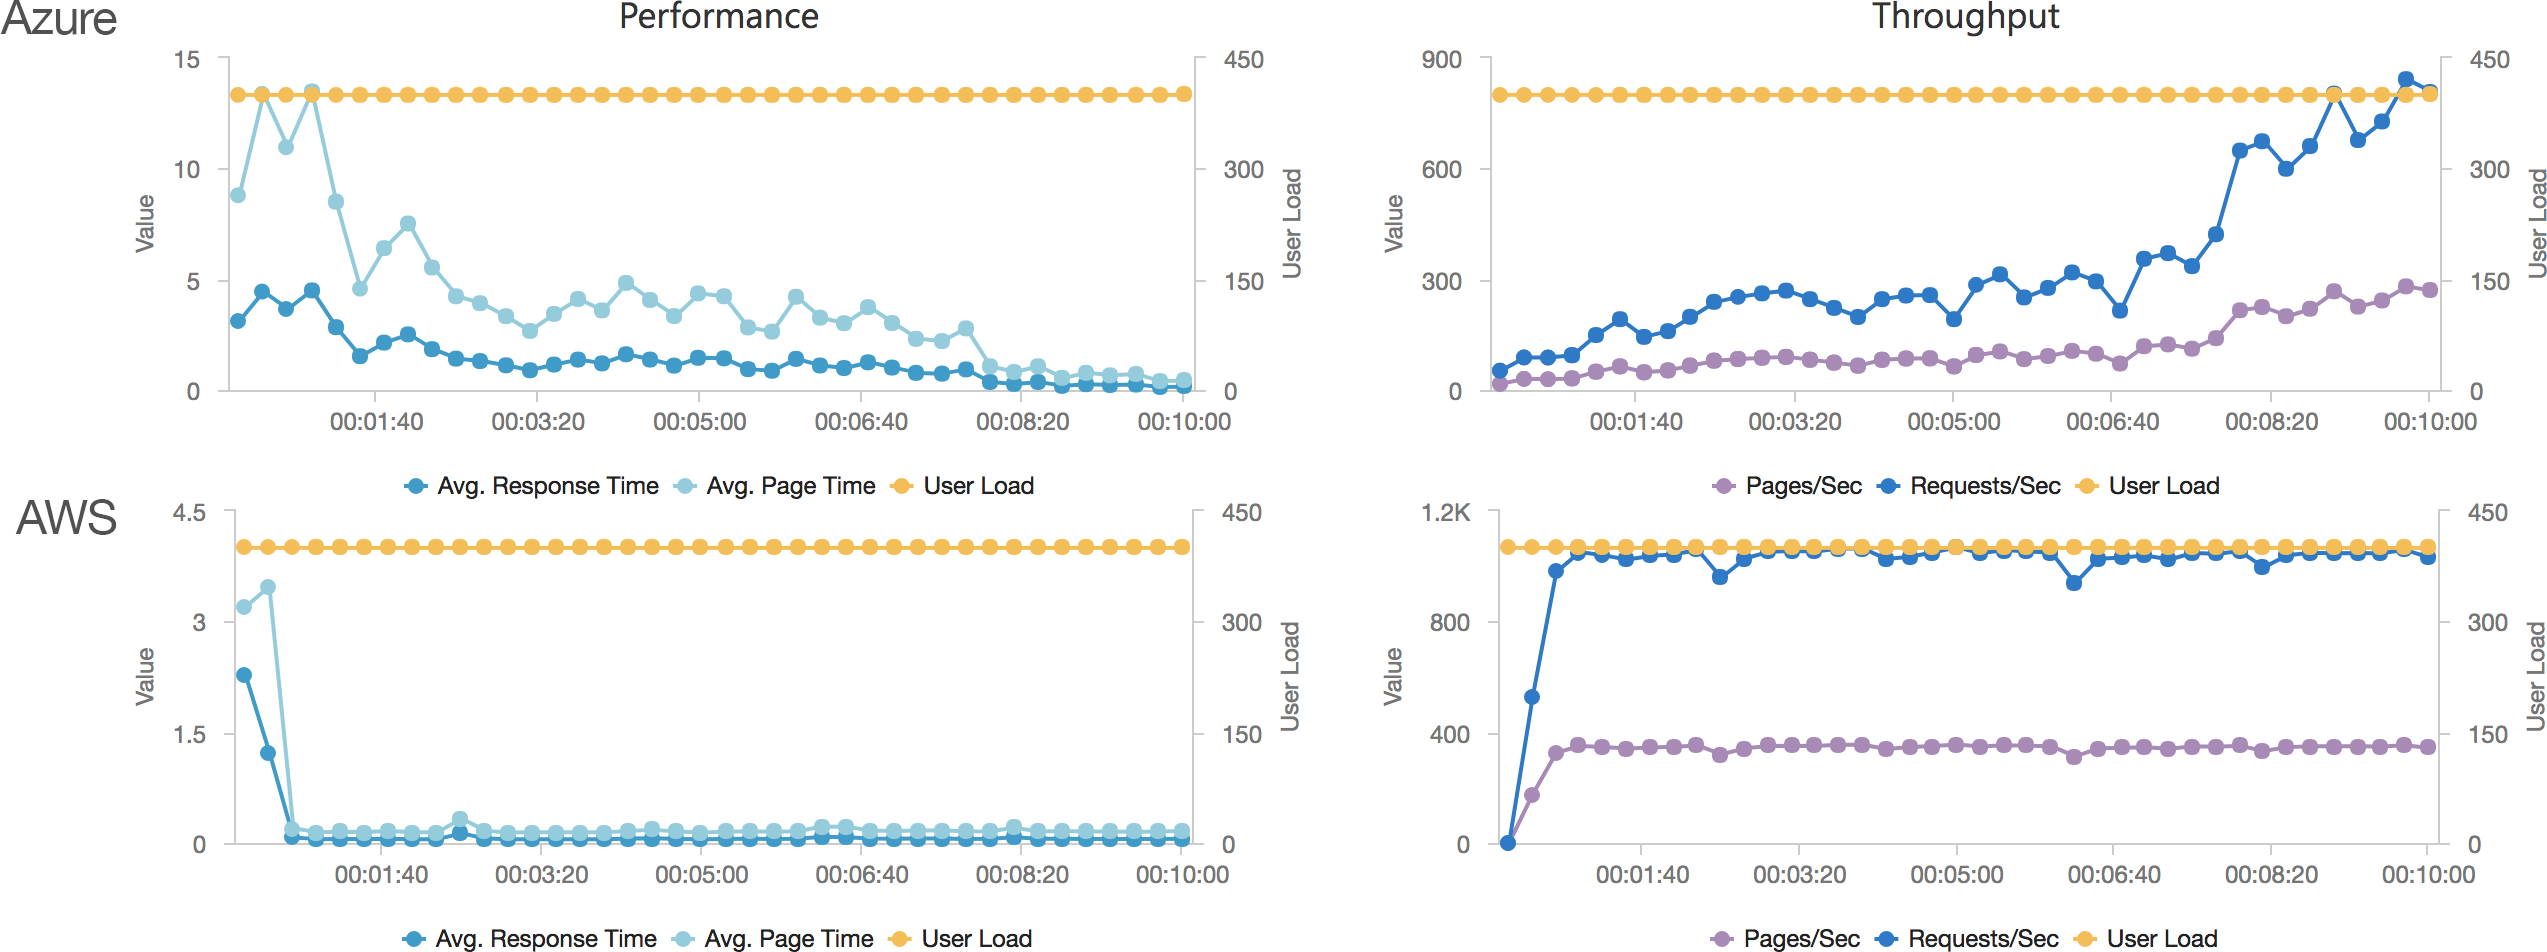
Let’s cover AWS first as it’s so simple: it quickly absorbs the load and hits a steady response time of around 80ms again in under a minute.

Azure, on the other hand, is more complex. Average response time doesn’t fall under a second until the test has been running for 7 minutes and it’s only around then that the system is able to get near the throughput AWS put out in a minute. Pretty disappointing and backed up by the overall stats for the run:

Again it’s striking just how improved the AWS stats over the Azure figures.

Constant Load of 1000 Concurrent Users

Same scenario as the last test but this time 1000 users. Lets get into the data:
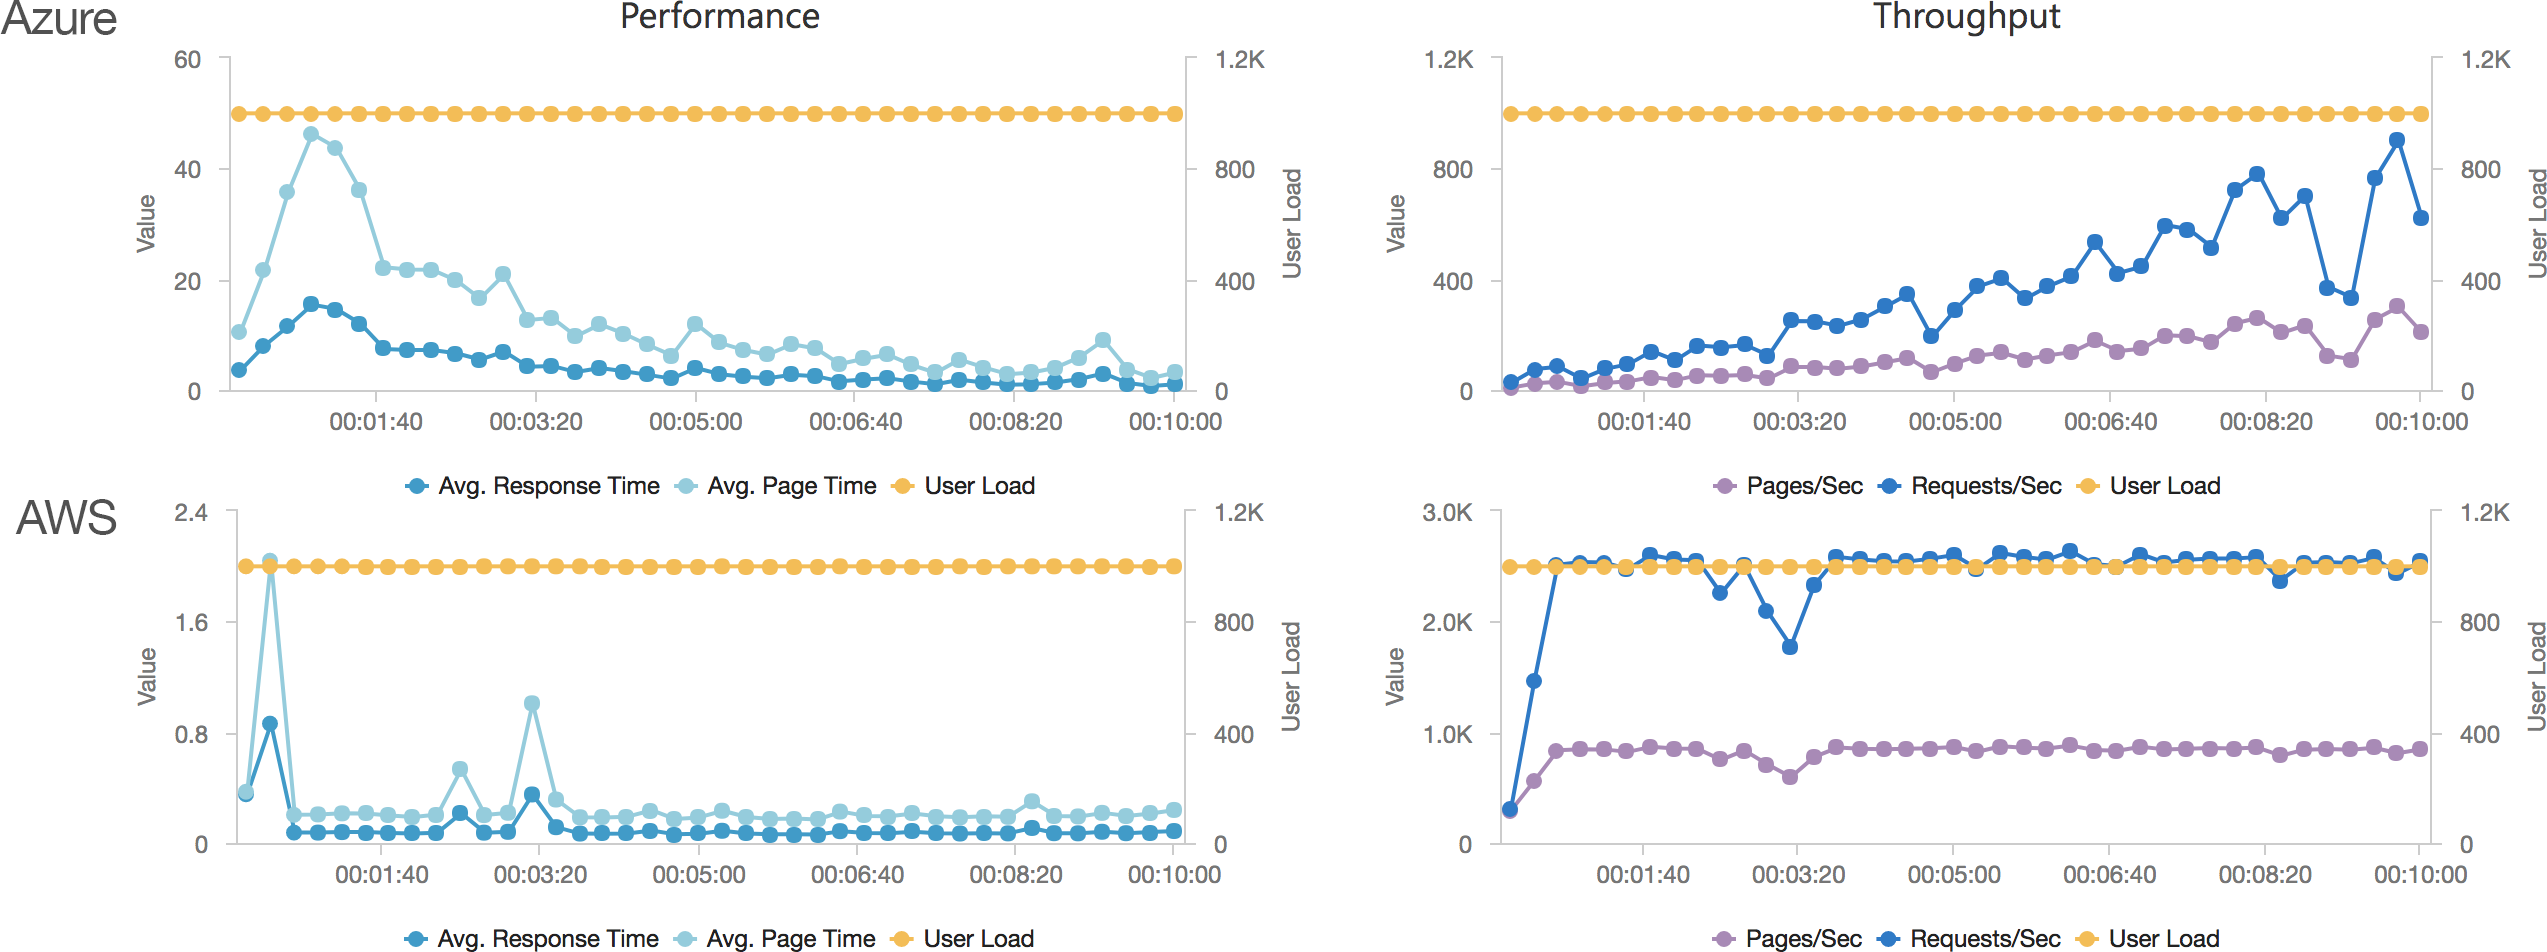
Again we can see a similar pattern with Azure slow to scale up to meet the demand while with AWS it is business as usual in under a minute. Interestingly at this level of concurrency AWS also error’d heavily during the early scaling:
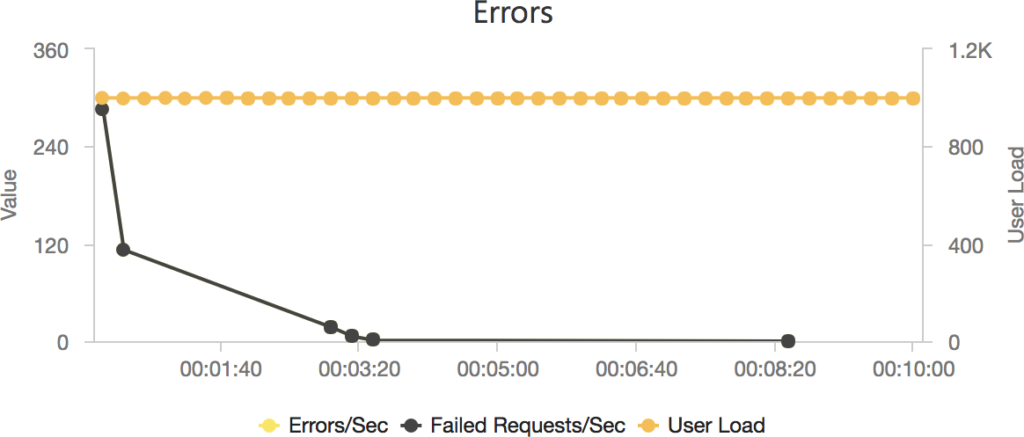
It should be noted that AWS specifically instructs you to implement retry and backoff handlers on the client which in the load test I am not doing, additionally at this point I am seeing throttle events in the logging for the AWS function – this is something I will look to come back to in the future. However its interesting to note the contrasting approaches of the two systems: Azure inflates it’s response time while AWS prefers to throw errors.

The average stats for the run:

Azure Functions

I don’t think there’s much point dancing around the issue: the above numbers are disappointing. Azure is slow to scale it’s HTTP triggered functions and once we get beyond the 100 concurrent users point the response times are never great and the experience is generally uneven. For customer facing API / web serving where low latency and response time are critical to a smooth user experience this really rules it out as an option. And it’s not just the .NET 4.6 variant that is poor as can be seen from my previous posts where I stripped test cases down to the most basic scenarios and used a variety of frameworks. The best case for Azure scaling I’ve found is using a CSX approach to return a string but even that lags behind AWS doing real work as the test cases in this post do:

using System.Net;

public static async Task<HttpResponseMessage> Run(HttpRequestMessage req, TraceWriter log)
{
    log.Info("C# HTTP trigger function processed a request.");

    var response = req.CreateResponse();
    response.StatusCode = HttpStatusCode.OK;
    response.Content = new StringContent("<html><head><title>Blog</title></head><body>Hello world</body></html>", System.Text.Encoding.UTF8, "text/html");

    return response;
}

With 1000 concurrent users over 5 minutes:

And with the add 2 users per second scenario:

Even in this final case, and remember this Azure Function is only returning a string, we can see the response time creeping up as the user load increases and the total number of requests served is only 77514 to AWS’s 215271 over the same period with a much lower number of requests per second.

In an additional attempt to validate my conclusion that the Azure Function system is poor at scaling I pointed the AWS Lambda installation at Azure Blob Storage instead of S3. In this test other than the function entry point semantics the code running on AWS is now taking exactly the same branches as the Azure tests and using the same underlying storage mechanism, albeit with a hop across the Internet to access the storage. I ran this scenario using the 400 concurrent user scenario:

We can see from this that other than a slightly increased response time due to the storage being hosted in another data centre AWS continues to perform well and scales up almost immediately and response time remains steady and low. We can also see their is no issue with Azure Blob Storage – if there was an issue there we’d expect to see it impact these results.

With these additional validation tests (an empty workload and AWS running against Blob Storage) that pretty much isolates the issue to the Azure Function runtime.

And it’s a shame as the developer experience is great, there is solid documentation, and plenty of samples, and the development team on Twitter are ludicrously responsive – to the point that I feel bad saying what I need to say here. I will reach out to them for feedback.

Why is this the case? Well I’d suggest the root of the issue is how the system has been built on top of App Service Plans. It’s not all that, well, serverless and you still find yourself worrying about, well, servers.

On Azure an App Service Plan is essentially a collection of rented servers / reserved compute power of a given spec (CPU, memory) and capabilities. Microsoft have layered what they call a Consumption Plan over this for Azure Functions which provides for automatic scaling and consumption based pricing. Unfortunately if you track what is going on your Functions are running on a limited number of these servers which you can evidence by tracking the instance ID and by sharing state between your functions (to be clear: this is not good!).

Essentially the level of granularity for scaling your functions remains, as in a traditional hosting model, at the server level and as your system scales up instances are slowly being added – but this is throttled tightly presumably to prevent Microsoft’s costs from spiralling out of control.

Now because they run on Application Service Plans you can switch hosting away from the Consumption plan onto a standard plan (which allows additional Azure features to be used) but this, to me, completely defeats the point of serverless. I’m paying for reserved compute again and managing server instance counts. I may as well not have bothered in the first place!

It’s hard to escape the feeling that Microsoft had to play catch up with AWS Lambda (it launched as a preview in late 2014 and went into general release in April 2015 whereas Azure Functions launched as a preview in March 2016 ) and built something they could market as serverless computing as quickly as they could by reusing existing compute and scaling systems on Azure.

Would I still use Azure Functions? Yes sure – in back end scenarios where latency isn’t all that important they’re a great fit. Anything that impacts user experience? No. Definitely not at this point.

It will be interesting to see if Microsoft revise the hosting model, I suspect if they do it’s some time off as currently they seem focused on the v2 runtime which isn’t a hosting change (as far as I can see) but rather giving Functions the ability to support more languages and .NET Core.

AWS Lambda

I’ll preface this by saying I am absolutely not an AWS expert so it’s harder for me to speculate about the underlying architecture of Lambda however… the numbers don’t lie: AWS manages to respond to changes in demand very quickly and, until I started to hit throttle limits (which I would need to speak to AWS Support to have lifted), is very consistent in response times.

I’ve not tried any state sharing but I would expect it to fail: it looks like Amazon have containerised at the Function level, rather than the host server, and this is what allows them to operate as you’d expect a serverless environment to. Both scaling and billing can then be at the function level.

Would I use AWS Lambda? Yes. But as most of my development work is on Azure I’m really hoping Microsoft bridge the capability gap.

Wrap Up and Next Steps

If you’ve followed this far – thanks! I’m a big fan of the serverless model but the Azure implementation of serverless looks like something of a compromised offering at this point and I’d be cautious of recommending it without understanding in detail the usage requirements as you will quickly hit choppy water.

I am planning on repeating similar experiments with the queue processing I began some time ago and if I get any information from Microsoft around this topic will make any corrections as appropriate. This is one of those times I’d love to have got things wrong.

Contact

  • If you're looking for help with C#, .NET, Azure, Architecture, or would simply value an independent opinion then please get in touch here or over on Twitter.
Recent Posts

Recent Tweets

Invalid or expired token.

Recent Comments

Archives

Categories

Meta

GiottoPress by Enrique Chavez