Category: Azure

Azure Functions – Scaling with a Dedicated App Service Plan

Since I published this piece Microsoft have made significant improvements to HTTP scaling on Azure Functions. I’ve not yet had the opportunity to test performance on dedicated app service plans but please see this post for a revised comparison on the Consumption Plan.

After my last few posts on the scaling of Azure Functions I was intrigued to see if they would perform any better running on a dedicated App Service Plan. Hosting them in this way allows for the functions to take full advantage of App Service features but, to my mind, is no long a serverless approach as rather than being billed based on usage you are essentially renting servers and are fully responsible for scaling.

I conducted a single test scenario: an immediate load of 400 concurrent users running for 5 minutes against the “stock” JavaScript function (no external dependencies, just returns a string) on 4 configurations:

  1. Consumption Plan – billed based on usage – approximately $130 per month
    (based on running constantly at the tested throughput that is around 648 million functions per month)
  2. Dedicated App Service Plan with 1 x S1 server -$73.20 per month
  3. Dedicated App Service Plan with 2 x S1 server – $146.40 per month
  4. Dedicated App Service Plan with 4 x S1 server – $292.80 per month

I also included AWS Lambda as a reference point.

The results were certainly interesting:

With immediately available resource all 3 App Service Plan configurations begin with response times slightly ahead of the Consumption Plan but at around the 1 minute mark the Consumption Plan overtakes our single instance configuration and at 2 minutes creeps ahead of the double instance configuration and, while the advantage is slight, at 3 minutes begins to consistently outperform our 4 instance configuration. However AWS Lambda remains some way out in front.

From a throughput perspective the story is largely the same with the Consumption Plan taking time to scale up and address the demand but ultimately proving more capable than even the 4x S1 instance configuration and knocking on the door of AWS Lambda. What I did find particularly notable is the low impact of moving from 2 to 4 instances on throughput – the improvement in throughput is massively disappointing – for incurring twice the cost we are barely getting 50% more throughput. I have insufficient data to understand why this is happening but do have some tests in mind that, time allowing, I will run and see if I can provide further information.

At this kind of load (650 million requests per month) from a bang per buck point of view Azure Functions on the Consumption Plan come out strongly compared to App Service instances even if we don’t allowing for quiet periods when Functions would incur less cost. If your scale profile falls within the capabilities of the service it’s worth considering though it’s worth remembering their isn’t really an SLA around Functions at the moment when running on the Consumption Plan (and to be fair the same applies to AWS Lambda).

If you don’t want to take advantage of any of the additional features that come with a dedicated App Service plan and although they can be provisioned to avoid the slow ramp up of the Consumption Plan are expensive in comparison.

Azure Functions vs AWS Lambda vs Google Cloud Functions – JavaScript Scaling Face Off

Since I published this piece Microsoft have made significant improvements to HTTP scaling on Azure Functions and the below is out of date. Please see this post for a revised comparison.

I had a lot of interesting conversations and feedback following my recent post on scaling a serverless .NET application with Azure Functions and AWS Lambda. A common request was to also include Google Cloud Functions and a common comment was that the runtimes were not the same: .NET Core on AWS Lambda and .NET 4.6 on Azure Functions. In regard to the latter point I certainly agree this is not ideal but continue to contend that as these are your options for .NET and are fully supported and stated as scalable serverless runtimes by each vendor its worth understanding and comparing these platforms as that is your choice as a .NET developer. I’m also fairly sure that although the different runtimes might make a difference to outright raw response time, and therefore throughput and the ultimate amount of resource required, the scaling issues with Azure had less to do with the runtime and more to do with the surrounding serverless implementation.

Do I think a .NET Core function in a well architected serverless host will outperform a .NET Framework based function in a well architected serverless host? Yes. Do I think .NET Framework is the root cause of the scaling issues on Azure? No. In my view AWS Lambda currently has a superior way of managing HTTP triggered functions when compared to Azure and Azure is hampered by a model based around App Service plans.

Taking all that on board and wanting to better evidence or refute my belief that the scaling issues are more host than framework related I’ve rewritten the test subject as a tiny Node / JavaScript application and retested the platforms on this runtime – Node is supported by all three platforms and all three platforms are currently running Node JS 6.x.

My primary test continues to be a mixed light workload of CPU and IO (load three blobs from the vendors storage offering and then compile and run a handlebars template), the kind of workload its fairly typical to find in a HTTP function / public facing API. However I’ve also run some tests against “stock” functions – the vendor samples that simply return strings. Finally I’ve also included some percentile based data which I obtained using Apache Benchmark and I’ve covered off cold start scenarios.

I’ve also managed to normalise the axes this time round for a clearer comparison and the code and data can all be found on GitHub:

https://github.com/JamesRandall/serverlessJsScalingComparison

(In the last week AWS have also added full support for .NET Core 2.0 on Lambda – expect some data on that soon)

Gradual Ramp Up

This test case starts with 1 user and adds 2 users per second up to a maximum of 500 concurrent users to demonstrate a slow and steady increase in load.

The AWS and Azure results for JavaScript are very similar to those seen for .NET with Azure again struggling with response times and never really competing with AWS when under load. Both AWS and Azure exhibit faster response times when using JavaScript than .NET.

Google Cloud Functions run fairly close to AWS Lambda but can’t quite match it for response time and fall behinds on overall throughput where it sits closer to Azure’s results. Given the difference in response time this would suggest Azure is processing more concurrent incoming requests than Google allowing it to have a similar throughput after the dip Azure encounters at around the 2:30 mark – presumably Azure allocates more resource at that point. That dip deserves further attention and is something I will come back to in a future post.

Rapid Ramp Up

This test case starts with 10 users and adds 10 users every 2 seconds up to a maximum of 1000 concurrent users to demonstrate a more rapid increase in load and a higher peak concurrency.

Again AWS handles the increase in load very smoothly maintaining a low response time throughout and is the clear leader.

Azure struggles to keep up with this rate of request increase. Response times hover around the 1.5 second mark throughout the growth stage and gradually decrease towards something acceptable over the next 3 minutes. Throughput continues to climb over the full duration of the test run matching and perhaps slightly exceeding Google by the end but still some way behind Amazon.

Google has two quite distinctively sharp drops in response time early on in the growth stageas the load increases before quickly stabilising with a response time around 140ms and levels off with throughput in line with the demand at the end of the growth phase.

I didn’t run this test with .NET, instead hitting the systems with an immediate 1000 users, but nevertheless the results are inline with that test particularly once the growth phase is over.

Immediate High Demand

This test case starts immediately with 400 concurrent users and stays at that level of load for 5 minutes demonstrating the response to a sudden spike in demand.

Both AWS and Google scale quickly to deal with the sudden demand both hitting a steady and low response time around the 1 minute mark but AWS is a clear leader in throughput – it is able to get through many more requests per second than Google due to its lower response time.

Azure again brings up the rear – it takes nearly 2 minutes to reach a steady response time that is markedly higher than both Google and AWS. Throughput continues to increase to the end of the test where it eventually peaks slightly ahead of Google but still some way behind AWS. It then experiences a fall off which is difficult to explain from the data available.

Stock Functions

This test uses the stock “return a string” function provided by each platform (I’ve captured the code in GitHub for reference) with the immediate high demand scenario: 400 concurrent users for 5 minutes.

With the functions essentially doing no work and no IO the response times are, as you would expect, smaller across the board but the scaling patterns are essentially unchanged from the workload function under the same load. AWS and Google respond quickly while Azure ramps up more slowly over time.

Percentile Performance

I was unable to obtain this data from VSTS and so resorted to running Apache Benchmarker. For this test I used settings of 100 concurrent requests for a total of 10000 requests, collected the raw data, and processed it in Excel. It should be noted that the network conditions were less predictable for these tests and I wasn’t always as geographically close to the cloud function as I was in other tests though repeated runs yielded similar patterns:

AWS maintains a pretty steady response time up to and including the 98th percentile but then shows marked dips in performance in the 99th and 100th percentiles with a worst case of around 8.5 seconds.

Google dips in performance after the 97th percentile with it’s 99th percentile roughly equivalent to AWSs 100th percentile and it’s own 100th percentile being twice as slow.

Azure exhibits a significant dip in performance at the 96th percentile with a sudden drop in response time from a not great 2.5 seconds to 14.5 seconds – in AWSs 100th percentile territory. Beyond the 96th percentile their is a fairly steady decrease in performance of around 2.5 seconds per percentile.

Cold Starts

All the vendors solutions go “cold” after a time leading to a delay when they start. To get a sense for this I left each vendor idle overnight and then had 1 user make repeat requests for 1 minute to illustrate the cold start time but also get a visual sense of request rate and variance in response time:

Again we have some quite striking results. AWS has the lowest cold start time of around 1.5 seconds, Google is next at 2.5 seconds and Azure again the worst performer at 9 seconds. All three systems then settle into a fairly consistent response time but it’s striking in these graphs how AWS Lambda’s significantly better performance translates into nearly 3x as many requests as Google and 10x more requests than Azure over the minute.

It’s worth noting that the cold start time for the stock functions is almost exactly the same as for my main test case – the startup is function related and not connected to storage IO.

Conclusions

AWS Lambda is the clear leader for HTTP triggered functions – on all the runtimes I’ve tried it has the lowest response times and, at least within the volumes tested, the best ability to deal with scale and the most consistent performance. Google Cloud Functions are not far behind and it will be interesting to see if they can close the gap with optimisation work over the coming year – if they can get their flat our response times reduced they will probably pull level with AWS. The results are similar enough in their characteristics that my suspicion is Google and AWS have similar underlying approaches.

Unfortunately, like with the .NET scenarios, Azure is poor at handling HTTP triggered functions with very similar patterns on show. The Azure issues are not framework based but due to how they are hosting functions and handling scale. Hopefully over the next few months we’ll see some improvements that make Azure a more viable host for HTTP serverless / API approaches when latency matters.

By all means use the above as a rough guide but ultimately whatever platform you choose I’d encourage you to build out the smallest representative vertical slice of functionality you can and test it.

Thanks for reading – hopefully this data is useful.

Azure Functions vs AWS Lambda – Scaling Face Off

Since I published this piece Microsoft have made significant improvements to HTTP scaling on Azure Functions and the below is out of date. Please see this post for a revised comparison.

If you’ve been following my blog recently you’ll know I’ve been spending a lot of time with the Azure Functions – Microsoft’s implementation of a serverless platform. The idea behind serverless appeals to me massively and seems like the natural next evolution of compute on the cloud with scaling and pricing being, so the premise goes, fully dynamic and consumption based.

The use of App Service Plans (more later) as a host mechanism for Azure Functions gave me some concern about how “serverless” Azure Functions might actually be and so to verify suitability for my use cases I’ve been running a range of different tests around response time and latency that culminated in the “real” application I described in my last blog post and some of the performance tests I ran along the way. I quickly learned that the hosting implementation is not particularly dynamic and so wanted to run comparable tests on AWS Lambda.

To do this I’ve ported the serverless blog over to AWS Lambda, S3 and DynamoDB (the, rather scruffy, code is in a branch on GitHub – I will tidy this up but the aim was to get the tests running) and then I’ve run a number of user volume scenarios against a single test case: loading the homepage. The operations involved in this are:

  1. A GET request to a serverless HTTP endpoint that:
    1. Loads 3 resources from storage (Blob Storage on Azure, S3 on AWS) in an asynchronous batch.
    2. Combines them together using a Handlebars template
    3. Returns the response as a string of type text/html.

On Azure I’m using .NET 4.6 on the v1 runtime while on AWS I’m using the same code running under .NET Core 1.0. It’s worth noting that latency on blob access remained minimal throughout all these tests (6ms on average across all loads) and when removing blob access from the tests it made little difference to the patterns.

Although the .NET 4.6 and Core runtimes are different (and accepted may exhibit different behaviours) these are the current general availability options for implementing serverless on the two platforms using .NET and both vendors claim full support for them. In Microsoft’s case some of the languages supported on the v1 Azure Functions runtime, the one tested here (v2 is in preview and has serious performance issues with .NET Core), are experimental and documented as having scale problems but C# (which runs under full framework .NET) is not one of them. Both vendors have .NET Core 2.0 support on the way and in preview but given the issues I’m waiting until they go on general availability until I compare them.

The results are, frankly, pretty damning when it comes to Azure Functions ability to scale dynamically and so let’s get into the data and then look at why.

A quick note on the graphs: I’ve pulled these from VSTS, it’s quite hard (or at least I don’t know how to!) equalise the scales and so please do look at the numbers carefully – the difference is quite startling.

Add 2 Users per Second

In this test scenario I’ve started with a single user and then added 2 users per second over a 5 minutes run time up to a maximum of 500 users:

We can see from this test that AWS matches the growth in user load almost exactly, it has no issue dealing with the growing demand and page requests time hover around the 100ms mark. Contrast this with Azure which always lags a little behind the demand, is spikier, and has a much higher response time hovering around the 700ms mark.

This is backed up by the average stats from the run:

It’s interesting to note just how many more requests AWS dealt with as a result of it’s better performance: 215271 as opposed to Azure’s 84419. Well over twice as many.

Constant Load of 400 Concurrent Users

This test hits the application with 400 concurrent users from a standing start and runs over a 10 minute period simulating a sudden spike or influx of traffic and looking at how quickly each serverless environment is able to deal with the load. Neither environment was completely cold as I’d been refreshing the view in the browser but neither had had any significant traffic for some time. The contrast is significant to say the least:

Let’s cover AWS first as it’s so simple: it quickly absorbs the load and hits a steady response time of around 80ms again in under a minute.

Azure, on the other hand, is more complex. Average response time doesn’t fall under a second until the test has been running for 7 minutes and it’s only around then that the system is able to get near the throughput AWS put out in a minute. Pretty disappointing and backed up by the overall stats for the run:

Again it’s striking just how improved the AWS stats over the Azure figures.

Constant Load of 1000 Concurrent Users

Same scenario as the last test but this time 1000 users. Lets get into the data:

Again we can see a similar pattern with Azure slow to scale up to meet the demand while with AWS it is business as usual in under a minute. Interestingly at this level of concurrency AWS also error’d heavily during the early scaling:

It should be noted that AWS specifically instructs you to implement retry and backoff handlers on the client which in the load test I am not doing, additionally at this point I am seeing throttle events in the logging for the AWS function – this is something I will look to come back to in the future. However its interesting to note the contrasting approaches of the two systems: Azure inflates it’s response time while AWS prefers to throw errors.

The average stats for the run:

Azure Functions

I don’t think there’s much point dancing around the issue: the above numbers are disappointing. Azure is slow to scale it’s HTTP triggered functions and once we get beyond the 100 concurrent users point the response times are never great and the experience is generally uneven. For customer facing API / web serving where low latency and response time are critical to a smooth user experience this really rules it out as an option. And it’s not just the .NET 4.6 variant that is poor as can be seen from my previous posts where I stripped test cases down to the most basic scenarios and used a variety of frameworks. The best case for Azure scaling I’ve found is using a CSX approach to return a string but even that lags behind AWS doing real work as the test cases in this post do:

using System.Net;

public static async Task<HttpResponseMessage> Run(HttpRequestMessage req, TraceWriter log)
{
    log.Info("C# HTTP trigger function processed a request.");

    var response = req.CreateResponse();
    response.StatusCode = HttpStatusCode.OK;
    response.Content = new StringContent("<html><head><title>Blog</title></head><body>Hello world</body></html>", System.Text.Encoding.UTF8, "text/html");

    return response;
}

With 1000 concurrent users over 5 minutes:

And with the add 2 users per second scenario:

Even in this final case, and remember this Azure Function is only returning a string, we can see the response time creeping up as the user load increases and the total number of requests served is only 77514 to AWS’s 215271 over the same period with a much lower number of requests per second.

In an additional attempt to validate my conclusion that the Azure Function system is poor at scaling I pointed the AWS Lambda installation at Azure Blob Storage instead of S3. In this test other than the function entry point semantics the code running on AWS is now taking exactly the same branches as the Azure tests and using the same underlying storage mechanism, albeit with a hop across the Internet to access the storage. I ran this scenario using the 400 concurrent user scenario:

We can see from this that other than a slightly increased response time due to the storage being hosted in another data centre AWS continues to perform well and scales up almost immediately and response time remains steady and low. We can also see their is no issue with Azure Blob Storage – if there was an issue there we’d expect to see it impact these results.

With these additional validation tests (an empty workload and AWS running against Blob Storage) that pretty much isolates the issue to the Azure Function runtime.

And it’s a shame as the developer experience is great, there is solid documentation, and plenty of samples, and the development team on Twitter are ludicrously responsive – to the point that I feel bad saying what I need to say here. I will reach out to them for feedback.

Why is this the case? Well I’d suggest the root of the issue is how the system has been built on top of App Service Plans. It’s not all that, well, serverless and you still find yourself worrying about, well, servers.

On Azure an App Service Plan is essentially a collection of rented servers / reserved compute power of a given spec (CPU, memory) and capabilities. Microsoft have layered what they call a Consumption Plan over this for Azure Functions which provides for automatic scaling and consumption based pricing. Unfortunately if you track what is going on your Functions are running on a limited number of these servers which you can evidence by tracking the instance ID and by sharing state between your functions (to be clear: this is not good!).

Essentially the level of granularity for scaling your functions remains, as in a traditional hosting model, at the server level and as your system scales up instances are slowly being added – but this is throttled tightly presumably to prevent Microsoft’s costs from spiralling out of control.

Now because they run on Application Service Plans you can switch hosting away from the Consumption plan onto a standard plan (which allows additional Azure features to be used) but this, to me, completely defeats the point of serverless. I’m paying for reserved compute again and managing server instance counts. I may as well not have bothered in the first place!

It’s hard to escape the feeling that Microsoft had to play catch up with AWS Lambda (it launched as a preview in late 2014 and went into general release in April 2015 whereas Azure Functions launched as a preview in March 2016 ) and built something they could market as serverless computing as quickly as they could by reusing existing compute and scaling systems on Azure.

Would I still use Azure Functions? Yes sure – in back end scenarios where latency isn’t all that important they’re a great fit. Anything that impacts user experience? No. Definitely not at this point.

It will be interesting to see if Microsoft revise the hosting model, I suspect if they do it’s some time off as currently they seem focused on the v2 runtime which isn’t a hosting change (as far as I can see) but rather giving Functions the ability to support more languages and .NET Core.

AWS Lambda

I’ll preface this by saying I am absolutely not an AWS expert so it’s harder for me to speculate about the underlying architecture of Lambda however… the numbers don’t lie: AWS manages to respond to changes in demand very quickly and, until I started to hit throttle limits (which I would need to speak to AWS Support to have lifted), is very consistent in response times.

I’ve not tried any state sharing but I would expect it to fail: it looks like Amazon have containerised at the Function level, rather than the host server, and this is what allows them to operate as you’d expect a serverless environment to. Both scaling and billing can then be at the function level.

Would I use AWS Lambda? Yes. But as most of my development work is on Azure I’m really hoping Microsoft bridge the capability gap.

Wrap Up and Next Steps

If you’ve followed this far – thanks! I’m a big fan of the serverless model but the Azure implementation of serverless looks like something of a compromised offering at this point and I’d be cautious of recommending it without understanding in detail the usage requirements as you will quickly hit choppy water.

I am planning on repeating similar experiments with the queue processing I began some time ago and if I get any information from Microsoft around this topic will make any corrections as appropriate. This is one of those times I’d love to have got things wrong.

Azure Functions v2 Preview Performance Issues (.NET Core / Standard)

I’ve been spending a little time building out a serverless web application as a small holiday project and as this is just a side project I’d taken the opportunity to try out the new .NET Core based v2 runtime for Azure Functions and the new tooling and support in Visual Studio 2017.

As soon as I had an end to end vertical slice I wanted to run some load tests to ensure it would scale up reliably – the short version is that it didn’t. The .NET Core v2 runtime is still in preview (and you are warned not to use this environment for production workloads due to potential breaking changes) so you would hope that this will get fixed by general release but right now there seem to be some serious shortcomings in the scalability and performance of this environment rendering it fairly unusable.

I used the VSTS load testing system to hit a single URL initially with a high volume of users for a few minutes. In isolation (i.e. if I run it from a browser with no activity) this function runs in less than 100ms and normally around the 70ms mark however as the number of users increases performance quickly takes a serious nosedive with requests taking seconds to return as can be seen below:

After things settled down a little (hitting a system like this from cold with a high concurrency is going to cause some chop while things scale out) average request time began to range in the 3 to 9 seconds and the anecdotal experience (me running it in a browser / PostMan while the test was going on) gave me highly variable performance. Some requests would take just a few hundred milliseconds while others would take over 20 seconds.

Worryingly no matter how long the test was run this never improved.

I began by looking at my code assuming I’d made a silly mistake but I couldn’t see anything and so boiled things down to a really simple test case, essentially the one that is created for you by the Visual Studio template:

[FunctionName("GetString")]
public static IActionResult Run([HttpTrigger(AuthorizationLevel.Anonymous, "get", Route = null)]HttpRequest req, TraceWriter log)
{
    log.Info("C# HTTP trigger function processed a request.");

    var result = new OkObjectResult("hello world");

    return (IActionResult)result;
}

I expected this to scale and perform much better as it’s as simple as it gets: return a hard coded string. However to my surprise this exhibited very similar issues:

The response time, to return a string!, hovered around the 7 second mark and the system never really scaled sufficiently to deal with a small percentage of failures due to the volume.

Having run a fair few tests and racking up a lot of billable virtual user minutes on my credit card I tweaked the test slightly at this point moving to a 5 minute test length with step up concurrent user growth. Running this on the same simple test gave me, again, poor results with average response times of between 1.5 and 2 seconds for 100 concurrent users and a function that is as close to doing nothing as it gets (the response time is hidden by the page time in the performance chart below, it tracks almost exactly). The step up of users to a fairly low volume eliminates the errors, as you’d expect.

What these graphs don’t show are variance around this average response time which still ranged from a few hundred milliseconds up to around 15 seconds.

At this point I was beginning to suspect the Functions 2.0 preview runtime might be the issue and so created myself a standard Functions 1.0 runtime and deployed this simple function as a CSX script:

using System.Net;

public static async Task<HttpResponseMessage> Run(HttpRequestMessage req, TraceWriter log)
{
    var response = req.CreateResponse();
    response.StatusCode = HttpStatusCode.OK;
    response.Content = new StringContent("hello world", System.Text.Encoding.UTF8, "text/plain");

    return response;
}

Running the same ramp up test as above shows that this function behaves much more as you’d expect with average response times in the 300ms to 400ms range when running at 100 concurrent users:

Intrigued I did run a short 5 minute 400 concurrent user test with no ramp up and again the csx based function behaved much more in line with what I think are reasonable expectations with it taking a short time to scale up to deal with the sudden demand but doing so without generating errors and eventually settling down to a response time similar to the test above:

Finally I deployed a .NET 4.6 based function into a new 1.0 runtime Function app. I made a slight mistake when setting up this test and ramped it up to 200 users rather than 100 but it scales much more as you’d expect and holds a fairly steady response time of around 150ms. Interestingly this gives longer response times than .NET Core for single requests run in isolation around 170ms for .NET 4.6 vs. 70ms for .NET Core.

At this point I felt fairly confident that the issue I was seeing in my application was due to the v2 Function runtime and so made a quick change to target .NET 4.6 instead and spun up a new v1 runtime and ran my initial 400 concurrent user test again:

As the system scales up, giving no errors, this test eventually settles at around the 500ms average request per second mark which is something I can move ahead with. I’d like to get it closer to 150ms and it will be interesting to see what I can tweak so I can on the consumption plan as I think I’m starting to bump up against some of the other limits with Functions (ironically resolving that involves taking advantage of what is actually going on with the Functions runtime implementation and accepting that its a somewhat flawed serverless implementation as it stands today).

As a more general conclusion the only real takeaway I have from the above (beyond the general point that it’s always worth doing some basic load testing even on what you assume to be simple code) is that the Azure Function 2.0 runtime has some way to go before it comes out of Preview. What’s running in Azure currently is suitable only for the most trivial of workloads – I wouldn’t feel able to run this even in a beta system today.

Something else I’d like to see from Azure Functions is a more aggressive approach to scaling up/out, for spiky workloads where low latency is important there is a significant drag factor at the moment. While you can run on an App Service Plan and handle the scaling yourself this kind of flies in the face of the core value proposition of serverless computing – I’m back to renting servers. A reserved throughput or Premium Consumption offering might make more sense.

I do plan on running these tests again once the runtime moves out of preview – I’m confident the issue will be fixed, after all to be usable as a service it basically has to be.

Azure Functions – Queue Trigger Scaling (Part 1)

I’m a big fan of the serverless compute model (known as Azure Functions on the Azure platform), but in some ways its greatest strength is also its weakness: the serverless model essentially asks you to run small units of code inside a fully managed environment on a pay for what you need basis that in theory will scale infinitely in response to demand. With the increased granularity this is the next evolution in cloud elasticity with no more need to buy and reserve CPUs which sit partially idle until the next scaling point is reached. However as a result you lose control over the levers you might be used to pulling in a more traditional cloud compute environment – it’s very much a black box. Using typical queue processing patterns as an example this includes the number of “threads” or actors looking at a queue and the length of the back off timings.

Most of the systems I’ve transitioned onto Azure Functions to date have been more focused on cost than scale and have had no particular latency requirements and so I’ve just been happy to reduce my costs without a particularly close examination. However I’m starting to look at moving spikier higher volume queue systems onto Azure Functions and so I’ve been looking to understand the opaque aspects more fully through running a series of experiments.

Before continuing it’s worth noting that Microsoft continue to evolve the runtime host for Azure Functions and so the results are only really valid at the time they are run – run them again in 6 months and you’re likely to see, hopefully subtle and improved, changes in behaviour.

Most of my higher volume requirements are light in terms of compute power but heavy on volume and so I’ve created a simple function that pulls a message from a Service Bus queue and writes it, along with a timestamp, onto an event hub:

[FunctionName("DequeAndForwardOn")]
[return: EventHub("results", Connection = "EhConnectionString")]
public static string Run([ServiceBusTrigger("testqueue", Connection = "SbConnectionString")]string myQueueItem, TraceWriter log)
{
    log.Info($"C# ServiceBus queue trigger function processed message: {myQueueItem}");
    EventHubOutput message = JsonConvert.DeserializeObject<EventHubOutput>(myQueueItem);
    message.ProcessedAtUtc = DateTime.UtcNow;
    string json = JsonConvert.SerializeObject(message);
    return json;
}

Once the items are on the Event Hub I’m using a Streaming Analytics job to count the number of dequeues per second with a tumbling window and output them to table storage:

SELECT
    System.TimeStamp AS TbPartitionKey,
    '' as TbRowKey,
    SUBSTRING(CAST(System.TimeStamp as nvarchar(max)), 12, 8) as Time,
    COUNT(1) AS totalProcessed
INTO
    resultsbysecond
FROM
    [results]
TIMESTAMP BY EventEnqueuedUtcTime
GROUP BY TUMBLINGWINDOW(second,1)

For this initial experiment I’m simply going to pre-load the Service Bus queue with 1,000,000 messages and analyse the dequeue rate. Taking all the above gives us a workflow that looks like this:

Executing all this gave some interesting results as can be seen from the graph below:

From a cold start it took just under 13 minutes to dequeue all 1,000,000 messages with a fairly linear, if spiky, approach to scaling up the dequeue rate from a low at the beginning of 23 dequeues per second to a peak of over 3000 increasing at a very rough rate of 3.2 messages per second. It seems entirely likely that this will go on until we start to hit IO limits around the Service Bus. We’d need to do more experiments to be certain but it looks like the runtime is allocating more queue consumers while all existing consumers continue to find their are items on the queue to process.

In the next part we’re going to run a few more experiments to help us understand the scaling rate better and how it is impacted by quiet periods.

C# Cloud Application Architecture – Commanding via a Mediator (Part 1)

When designing cloud based systems we often think about the benefits of loosely coupling systems, for example through queues and pub/sub mechanisms, but fall back on more traditional onion or layered patterns for the application architecture when alternative approaches might provide additional benefits.

My aim over a series of posts is to show how combining the Command pattern with the Mediator pattern can yield a number of benefits including:

  • A better separation of concerns with a clear demarkation of domains
  • An internally decomposed application that is simple to work with early in it’s lifecycle yet can easily evolve into a microservice approach
  • Is able to reliably support none-transactional or distributed data storage operations
  • Less repetitive infrastructure boilerplate to write such as logging and telemetry

To illustrate this we’re going to refactor an example application, over a number of stages, from a layered onion ring style to a decoupled in-process application and finally on through to a distributed application. An up front warning, to get the most out of these posts a fair amount of code reading is encouraged. It doesn’t make sense for me to walk through each change and doing so would make the posts ridiculously long but hopefully the sample code provided is clear and concise. It really is designed to go along with the posts.

The application is a RESTful HTTP API supporting some basic, simplified, functionality for an online store. The core API operations are:

  • Shopping cart management: get the cart, add products to the cart, clear the cart
  • Checkout: convert a cart into an order, mark the order as paid
  • Product: get a product

To support the above there is also a sense of store product catalog, it’s not exposed through the API, but it is used internally.

I’m going to be making use of my own command mediation framework AzureFromTheTrenches.Commanding as it has some features that will be helpful to us as we progress towards a distributed application but alternatives are available such as the popular Mediatr and if this approach appeals to you I’d encourage you to look at those too.

Our Starting Point

The code for the onion ring application, our starting point, can be found on GitHub:

https://github.com/JamesRandall/CommandMessagePatternTutorial/tree/master/Part1a

Firstly lets define what I mean by onion ring or layered architecture. In the context of our example application it’s a series of layers built one on top of the other with calls up and down the chain never skipping a layer: the Web API talks to the application services, the application services to the data access layer, and the data access layer to the storage. Each layer drives the one below. To support this each layer is broken out into it’s own assembly and a mixture of encapsulation (at the assembly and class level) and careful reference management ensures this remains the case.

In the case of our application this looks like this:

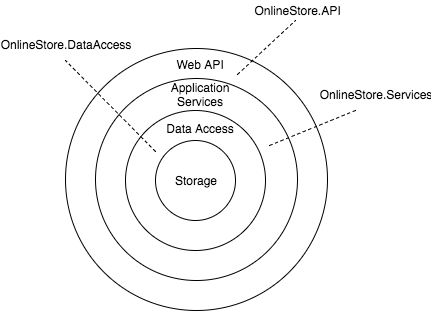
Concrete class coupling is avoided through the use of interfaces and these are constructor injected to promote a testable approach. Normally in such an architecture each layer has its own set of models (data access models, application models etc.) with mapping taking place between them however for the sake of brevity, and as I’m just using mock data stores, I’ve ignored this and used a single set of models that can be found in the OnlineStore.Model assembly.

As this is such a common pattern, it’s certainly the pattern I’ve come across most often over the last few years (where application architecture has been considered at all – sadly the spaghetti / make it up as you go along approach is still prevalent), it’s worth looking at what’s good about it:

  1. Perhaps most importantly – it’s simple. You can draw out the architecture on a whiteboard with a set of circles or boxes in 30 seconds and it’s quite easy to explain what is going on and why
  2. It’s testable, obviously things get more complicated in the real world but above the data access layer testing is really easy: everything is mockable and the major concrete external dependencies have been isolated in our data access layer.
  3. A good example of the pattern is open for extension but closed for modification: because their are clear contractual interfaces decorators can be added to, for example, add telemetry without modifying business logic.
  4. It’s very well supported in tooling – if you’re using Visual Studio it’s built in refactoring tools or Resharper will have no problem crunching over this solution to support changes and help keep things consistent.
  5. It can be used in a variety of different operating environments, I’ve used a Web API for this example but you can find onion / layer type architectures in all manner of solutions.
  6. It’s what’s typically been done before – most engineers are familiar with the pattern and its become almost a default choice.

I’ve built many successful systems myself using this pattern and, to a point, its served me well. However I started looking for better approaches as I experienced some of the weaknesses:

  1. It’s not as loosely coupled and malleable as it seems. This might seem an odd statement to make given our example makes strong use of interfaces and composition via dependency injection, an approach often seen to promote loose coupling and flexibility. And it does to a point. However we still tend to think of operations in such an architecture in quite a tightly coupled way: this controller calls this method on this interface which is implemented by this service class and on down through the layers. It’s a very explicit invocation process.
  2. Interfaces and classes in the service layer often become “fat” – they tend to end up coupled around a specific part of the application domain (in our case, for example, the shopping basket) and used to group together functionality.
  3. As an onion ring application gets larger it’s quite common for the Application Layer to begin to resemble spaghetti – repositories are made reference to from across the code base, services refer to services, and helpers to other helpers. You can mitigate this by decomposing the application layer into further assemblies, and making use of various design patterns, but it only takes you so far. These are all sticking plaster over a fundamental problem with the onion ring approach: it’s designed to segregate at the layer level not at the domain or bounding context level (we’ll talk about DDD later). It’s also common to see concerns start to bleed across the layer with what once were discrete boundaries.
  4. In the event of fundamental change the architecture can be quite fragile and resistant to easy change. Let’s consider a situation where our online store has become wildly successful and to keep it serving the growing userbase we need to break it apart to handle the growing scale. This will probably involve breaking our API into multiple components and using patterns such as queues to asynchronously run and throttle some actions. With the onion ring architecture we’re going to have to analyse what is probably a large codebase looking for how we can safely break it apart. Almost inevitably this will be more difficult than it first seems and it will probably seem quite difficult to begin with (I may have been here myself!) and we’ll uncover all manner of implicit tight coupling points.

There are of course solutions to many of these problems, particularly the code organisation issues, but at some point it’s worth considering if the architecture is still helping you or beginning to hinder you and if perhaps there are alternative approaches.

With that in mind, and as I said earlier, I’d like to introduce an alternative. It’s by no means the alternative but its one I’ve found tremendously helpful when building applications for the cloud.

The Command Pattern with a Mediator

The classic command pattern aims to encapsulate all the information needed to perform an action typically within a class that contains properties (the data needed to perform the action) and an execute method (that undertakes the action). For example:

public class GetProductCommand : ICommand<Product>
{
    public Guid ProductId { get; set; }

    public Task<Product> Execute()
    {
         /// ... logic
    }
}

This can be a useful way of structuring an application but tightly couples state and execution and that can prove limiting if, for example, it would be helpful for the command to participate in a pub/sub approach, take part in a command chain (step 1 – store state in undo, step 2 – execute command, step 3 – log command was executed), or operate across a process boundary.

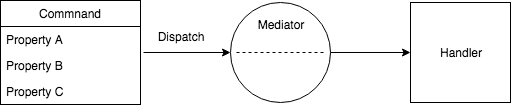
A powerful improvement can be made to the approach by decoupling the execution from the command state via the mediator pattern. In this pattern all commands, each of which consist of simple serializable state, are dispatched to the mediator and the mediator determines which handlers will execute the command:

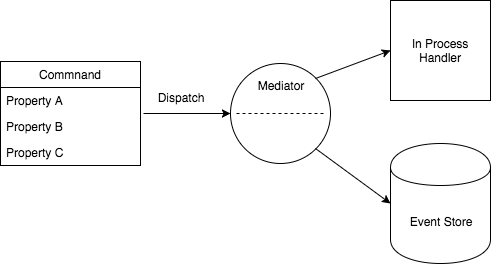
Because the command is decoupled from execution it is possible to associate multiple handlers with a command and moving a handler to a different process space (for example splitting a Web API into multiple Web APIs) is simply a matter of changing the configuration of the mediator. And because the command is simple state we can easily serialize it into, for example, an event store (the example below illustrates a mediator that is able to serialize commands to stores directly, but this can also be accomplished through additional handlers:

It’s perhaps worth also briefly touching on the CQRS pattern – while the Command Message pattern may facilitate a CQRS approach it neither requires it or has any particular opinion on it.

With that out the way lets take a look at how this pattern impacts our applications architecture. Firstly the code for our refactored solution can be found here:

https://github.com/JamesRandall/CommandMessagePatternTutorial/tree/master/Part1b

And from our layered approach we now end up with something that looks like this:

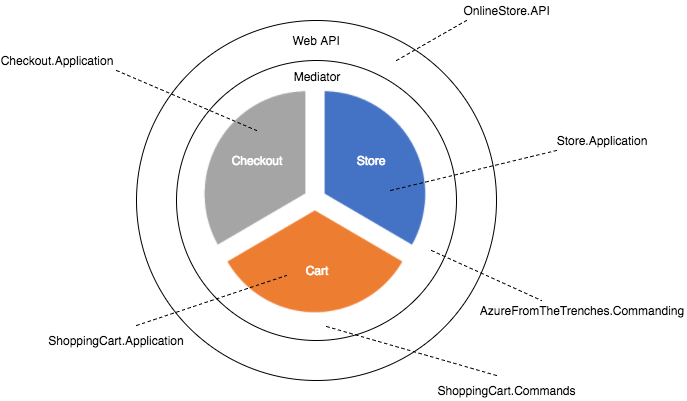
It’s important to realise when looking at this code that we’re going to do more work to take advantage of the capabilities being introduced here. This is really just a “least work” refactor to demonstrate some high level differences – hopefully over the next few posts you’ll see how we can really use these capabilities to simplify our solution. However even at this early stage there are some clear points to note about how this effects the solution structure and code:

  1. Rather than structure our application architecture around technology we’ve restructured it around domains. Where previously we had a data access layer, an application layer and an API layer we now have a shopping cart application, a checkout application, a product application and a Web API application. Rather than the focus being about technology boundaries its more about business domain boundaries.
  2. Across boundaries (previously layers, now applications) we’ve shifted our invocation semantics from interfaces, methods and parameters to simple state that is serializable and persistable and communicated through a “black box” mediator or dispatcher. The instigator of an operation no longer has any knowledge about what will handle the operation and as we’ll see later that can even include the handler executing in a different process space such as another web application.
  3. I’ve deliberately used the term application for these business domain implementations as even though they are all operating in the same process space it really is best to think of them as self contained units. Other than a simple wiring class to allow them to be configured in the host application (via a dependency injector) they interoperate with their host (the Web API) and between themselves entirely through the dispatch of commands.
  4. The intent is that each application is fairly small in and of itself and that it can take the best approach required to solve it’s particular problem. In reality it’s quite typical that many of the applications follow the same conventions and patterns, as they do here, and when this is the case its best to establish some code organisation concentions. In fact it’s not uncommon to see a lightweight onion ring architecture used inside each of these applications (so for lovers of the onion ring – you don’t need to abandon it completely!).

Let’s start by comparing the controllers. In our traditional layered architecture our product controller looked like this:

[Route("api/[controller]")]
public class ProductController : Controller
{
    private readonly IProductService _productService;

    public ProductController(IProductService productService)
    {
        _productService = productService;
    }

    [HttpGet("{id}")]
    public async Task<StoreProduct> Get(Guid id)
    {
        return await _productService.GetAsync(id);
    }
}

As expected this accepts an instance of a service, in this case of an IProductService, and it’s get method simply passes the ID on down to it. ALthough the controller is abstracted away from the implementation of the IProductService it is clearly and directly linked to one type of service and a method on that service.

Now lets look at its replacement:

[Route("api/[controller]")]
public class ProductController : Controller
{
    private readonly ICommandDispatcher _dispatcher;

    public ProductController(ICommandDispatcher dispatcher)
    {
        _dispatcher = dispatcher;
    }

    [HttpGet("{id}")]
    public async Task Get(Guid id)
    {
        return await _dispatcher.DispatchAsync(new GetStoreProductQuery
        {
            ProductId = id
        });
    }
}

In this implementation the controller accepts an instance of ICommandDispatcher and then rather than invoke a method on a service it calls DispatchAsync on that dispatcher supplying it a command model. The controller no longer has any knowledge of what is going to handle this request and all our commands are executed by discrete handlers. In this case the GetStoreProductQuery command is handled the the GetStoreProductQueryHandler in the Store.Application assembly:

internal class GetStoreProductQueryHandler : ICommandHandler<GetStoreProductQuery, StoreProduct>
{
    private readonly IStoreProductRepository _repository;

    public GetStoreProductQueryHandler(IStoreProductRepository repository)
    {
        _repository = repository;
    }

    public Task<StoreProduct> ExecuteAsync(GetStoreProductQuery command, StoreProduct previousResult)
    {
        return _repository.GetAsync(command.ProductId);
    }
}

It really does no more than the implementation of the ProductService in our initial application but importantly derives from the ICommandHandler generic interface supplying as generic types the type of the command it is handling and the result type. Our command mediation framework takes care of routing the command to this handler and will ultimately call ExecuteAsync on it. The framework we are using here allows commands to be chained and so as well as being given the command state it is also given any previous result.

Handlers are registered against actors as follows (this can be seen in the IServiceCollectionExtenions.cs file of Store.Application):

commandRegistry.Register<GetStoreProductQueryHandler>();

The command mediation framework has all it needs from the definition of GetStoreProductQueryHandler to map the handler to the command.

I think it’s fair to say that’s all pretty loosely coupled! In fact its so loose that if we weren’t going to go on to make more of this pattern we might conclude that the loss of immediate traceability is not worth it.

In the next part we’re going to visit some of our more complicated controllers and commands, such as the Put verb on the ShoppingCartController, to look at how we can massively simplify the code below:

[HttpPut("{productId}/{quantity}")]
public async Task<IActionResult> Put(Guid productId, int quantity)
{
    CommandResponse response = await _dispatcher.DispatchAsync(new AddToCartCommand
    {
        UserId = this.GetUserId(),
        ProductId = productId,
        Quantity = quantity
    });
    if (response.IsSuccess)
    {
        return Ok();
    }
    return BadRequest(response.ErrorMessage);
}

By way of a teaser the aim is to end up with really thin controller action that, across the piece, look like this:

[HttpPut("{productId}/{quantity}")]
public async Task<IActionResult> Put([FromRoute] AddToCartCommand command) => await ExecuteCommand(command);

We’ll then roll that approach out over the rest of the API. Then get into some really cool stuff!

Other Parts in the Series

Part 5
Part 4
Part 3
Part 2

Upgrading an ASP.Net Core 1.1 project to ASP.Net Core 2.0 and run on Azure

Following the instructions on the ASP.Net Core 2.0 announcement blog post I was quickly able to get a website updated to ASP.Net Core 2.0 and run it locally.

The website is hosted on Azure in the App Service model and unfortunately after publishing my project I encountered IIS 502.5 errors. Luckily this was in a deployment slot so my public website was unaffected.

After a bit of head scratching I found two extra steps were required to upgrade an existing web site.

Firstly In your .csproj file you should have an ItemGroup like the one below:

<ItemGroup>
    <DotNetCliToolReference Include="Microsoft.VisualStudio.Web.CodeGeneration.Tools" Version="1.0.1" />
</ItemGroup>

You need to change the version to 2.0.0.

Secondly you need to clear out all the old files from your Azure hosted instance. The easiest way to do this is to open Kudu (Advanced Tools in the portal), navigate to the site/wwwroot folder and delete them.

After that if you publish your website again it should work fine.

Hope that saves someone a few hours of head-scratching.

PowerShell, Binding Redirects, and Visual Studio Team Services

I’ve blogged previously about setting up binding redirects for Powershell with Newtonsoft.Json being a particularly troublesome package – it’s such a common dependency for NuGet packages that if you deal with a complex project you’ll almost certainly need a redirect in your app/web.config’s to get things to play ball and if you use the Azure cmdlets with others (such as your own) you’re likely to face this problem in Powershell.

I’ve recently moved my projects into Visual Studio Team Services using the new (vastly improved!) scriptable build system where I often make use of the PowerShell script task to perform custom actions. If you hit a dependency issue that requires a binding redirect to resolve then my previous approach of creating a Powershell.exe.config file for PowerShell won’t work in VSTS as unless you build a custom build agent you don’t have access to the machine at this level.

After a bit of head scratching I came up with an alternative solution that in many ways is neater and more generally portable as it doesn’t require any special machine setup. My revised approach is to hook the AssemblyResolve event and return a preloaded target assembly as shown in the example below:

Note that you can’t use the more common Register-ObjectEvent method of subscribing to events as this will balk at the need for a return value.

You can of course use this technique to deal with other assemblies that might be giving you issues.

Capturing and Tracing All HTTP Requests in C# and .Net

Modern applications are complex and often rely on a large number of external resources increasingly accessed using HTTP – for example most Azure services are interacted with using the HTTP protocol.

That being the case it can be useful to get a view of the requests your application is making and while this can be done with a tool like Fiddler that’s not always convenient in a production environment.

If you’re using the HttpClient class another option is to pass a custom message handler to it’s constructor but this relies on you being in direct control of all the code making HTTP requests and that’s unlikely.

A simple way of capturing this information without getting into all the unpleasantness of writing a TCP listener or HTTP proxy is to use the System.Diagnostics namespace. From .net 4.5 onwards the framework has been writing HTTP events to the System.Diagnostics.Eventing.FrameworkEventSource source. This isn’t well documented and I found the easiest way to figure out what events are available, and their Event IDs, is to read the source.

Once you’ve found the HTTP events it’s quite straightforward to write an event listener that listens to this source. The below class will do this and output the details to the trace writer (so you can view it in the Visual Studio Debug Output window) but you can easily output it to a file, table storage, or any other output format of your choosing.

To set it running all you need to do is instantiate the class.

If you’d like to see this kind of data and much more, collected, correlated and analysed then you might want to check out my project Hub Analytics that is currently running a free beta.

Changing the App Service Plan of an Azure App Service

To allow a number of App Services to scale independently I needed to pull one of them out of an App Service Plan where it had lived with 3 others to sit in it’s own plan – experience had shown me that it’s scaling characteristics are really quite different from the other App Services.

You can do this straightforwardly and pretty much instantly either in the Portal (there’s a Change App Service Plan option in Settings) or with PowerShell (with the Set-AzureRmAppServicePlan cmdlet).

Super simple – but I did encounter one gotcha. This doesn’t move any deployment slots you might have created and so you end up in a situation with the main App Service sat in one App Service Plan and it’s deployment slots in another which probably isn’t what you want and, in any case, Azure won’t let you swap slots in different service plans.

The solution is simple: you can also move them between App Service Plans in the same way.


Contact

  • If you're looking for help with C#, .NET, Azure, Architecture, or would simply value an independent opinion then please get in touch here or over on Twitter.

Recent Posts

Recent Tweets

Invalid or expired token.

Recent Comments

Archives

Categories

Meta

GiottoPress by Enrique Chavez